Tangling is easy. Untangling is hard
Nicholas Tierney
Telethon Kids Institute, Perth, Australia
JSM, 8th/9th Aug, 2021
bit.ly/njt-jsm21
nj_tierney
How to make better spaghetti 🍝
How to make better spaghetti 🍝
How to explore longitudinal data effectively
What even is longitudinal data?
What even is longitudinal data?
Individuals repeatedly measured through time
What even is longitudinal data?
| country | year | height_cm |
|---|---|---|
| Australia | 1910 | 173 |
What even is longitudinal data?
| country | year | height_cm |
|---|---|---|
| Australia | 1910 | 173 |
| Australia | 1920 | 173 |
What even is longitudinal data?
| country | year | height_cm |
|---|---|---|
| Australia | 1910 | 173 |
| Australia | 1920 | 173 |
| Australia | 1960 | 176 |
What even is longitudinal data?
| country | year | height_cm |
|---|---|---|
| Australia | 1910 | 173 |
| Australia | 1920 | 173 |
| Australia | 1960 | 176 |
| Australia | 1970 | 178 |
What even is longitudinal data?
| country | year | height_cm |
|---|---|---|
| Australia | 1910 | 173 |
| Australia | 1920 | 173 |
| Australia | 1960 | 176 |
| Australia | 1970 | 178 |
🎉 Individuals repeatedly measured through time
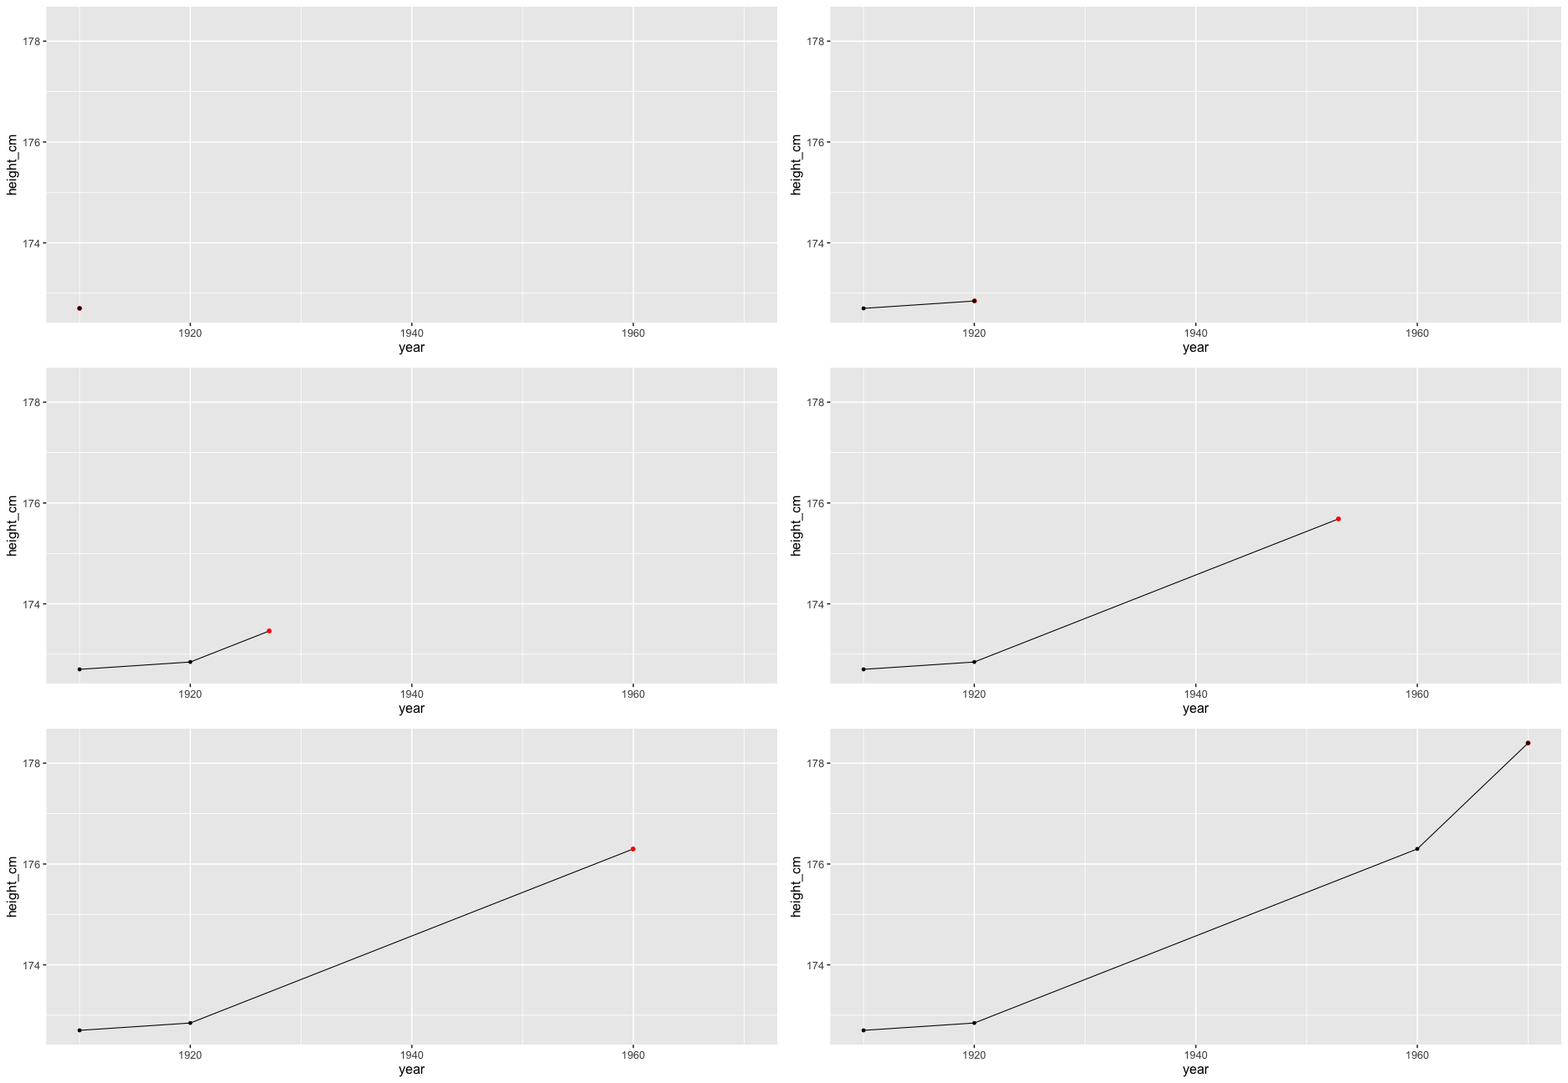
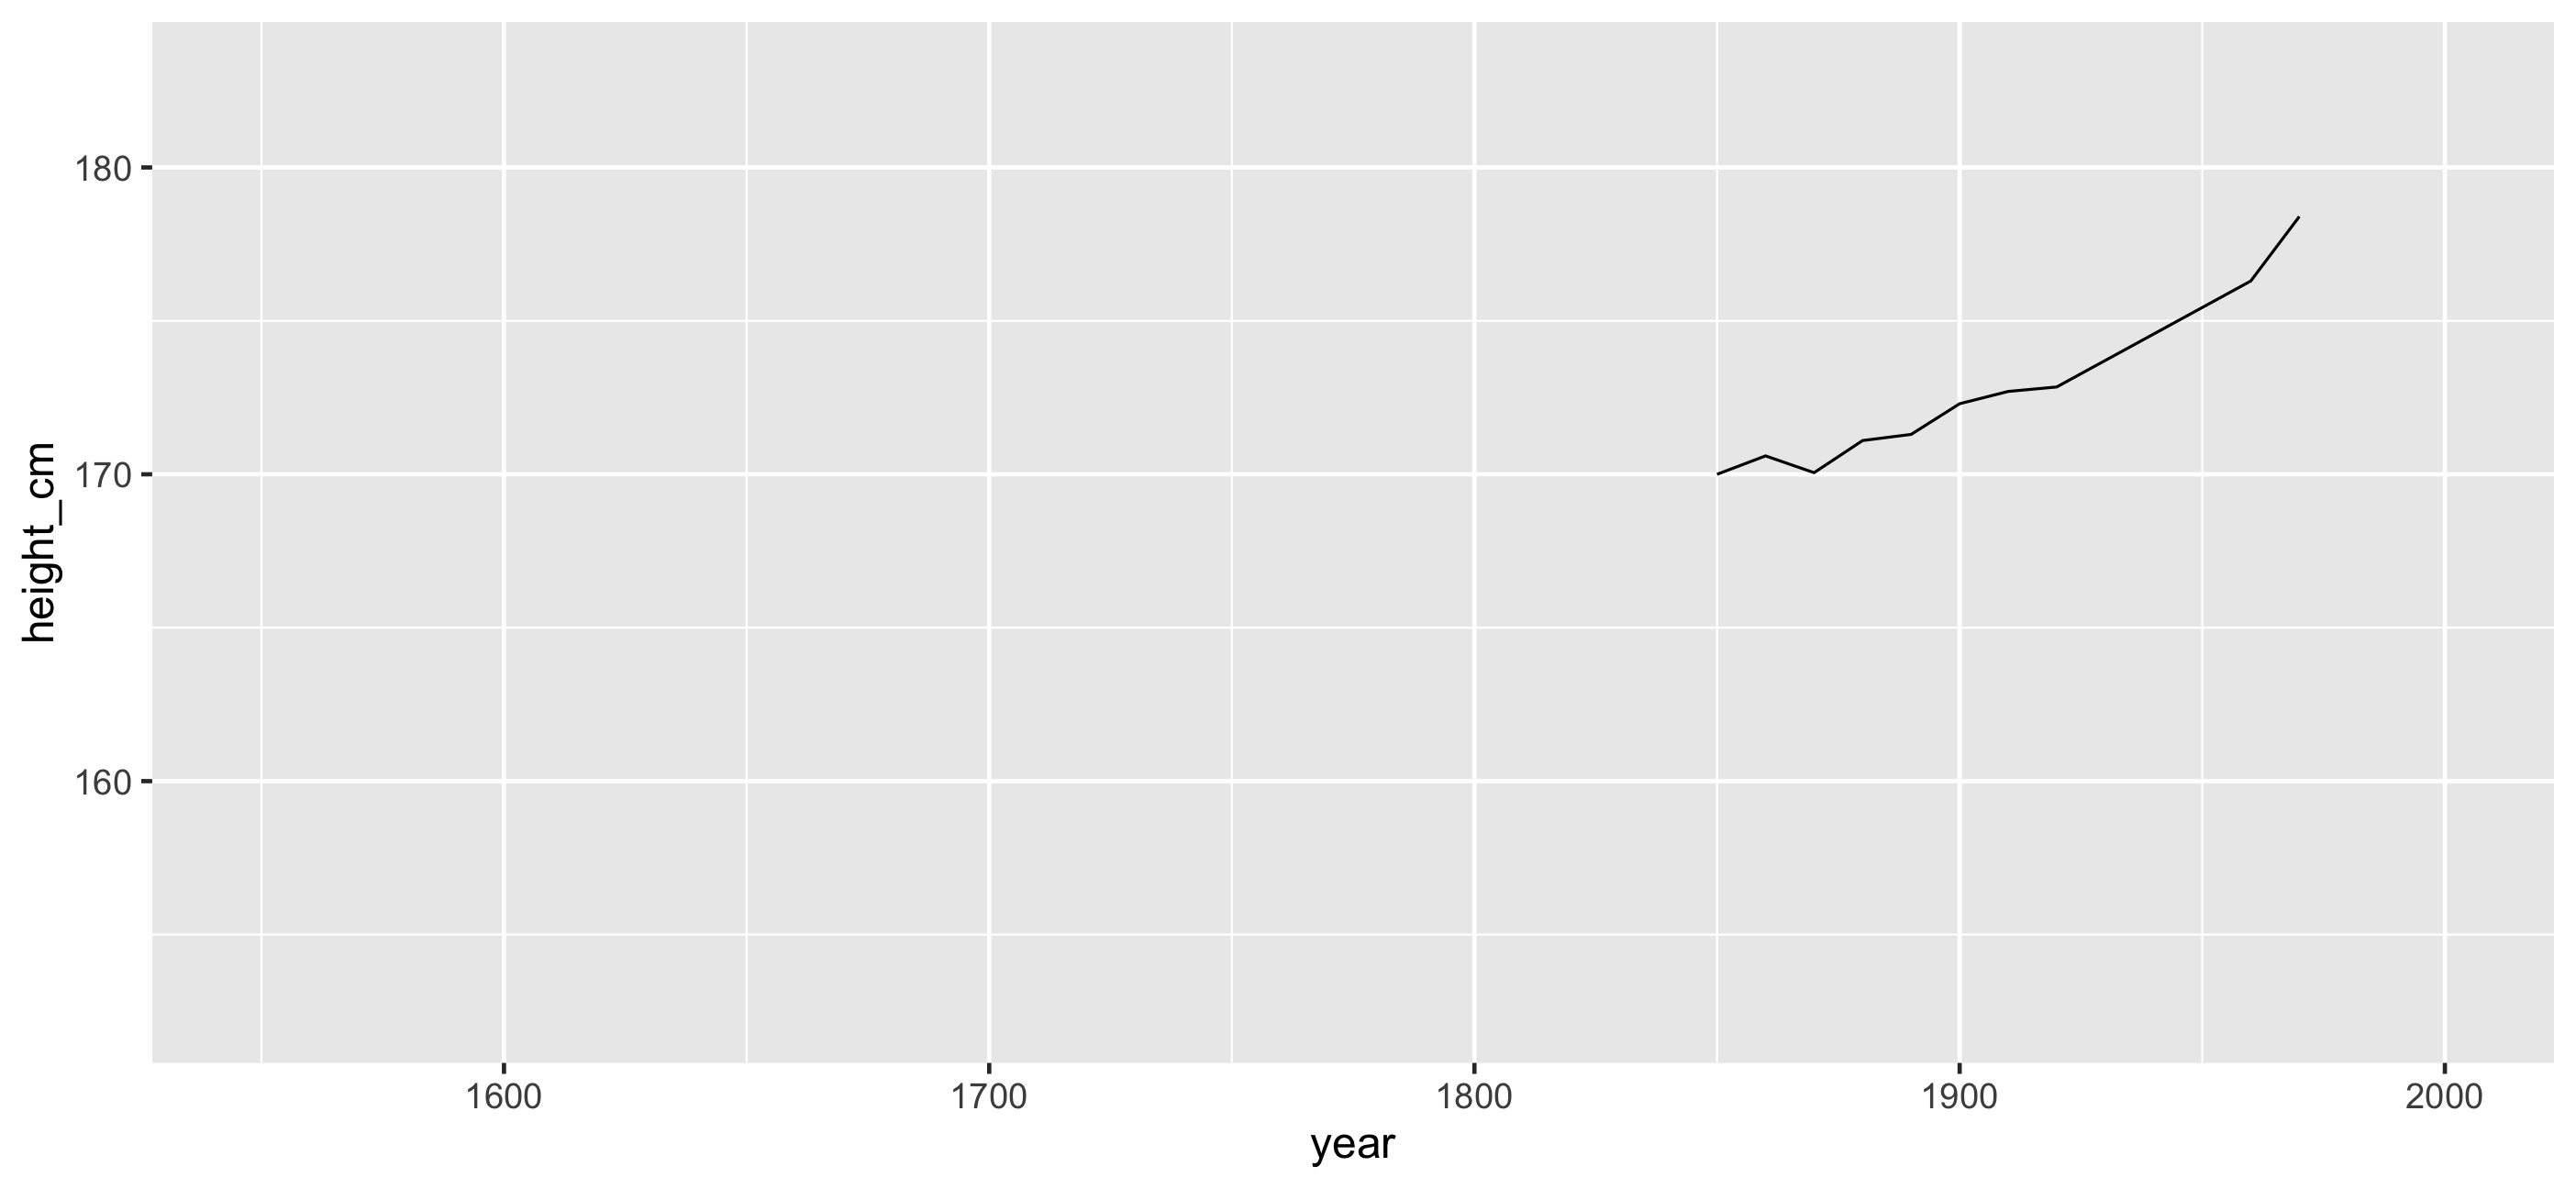
All of Australia
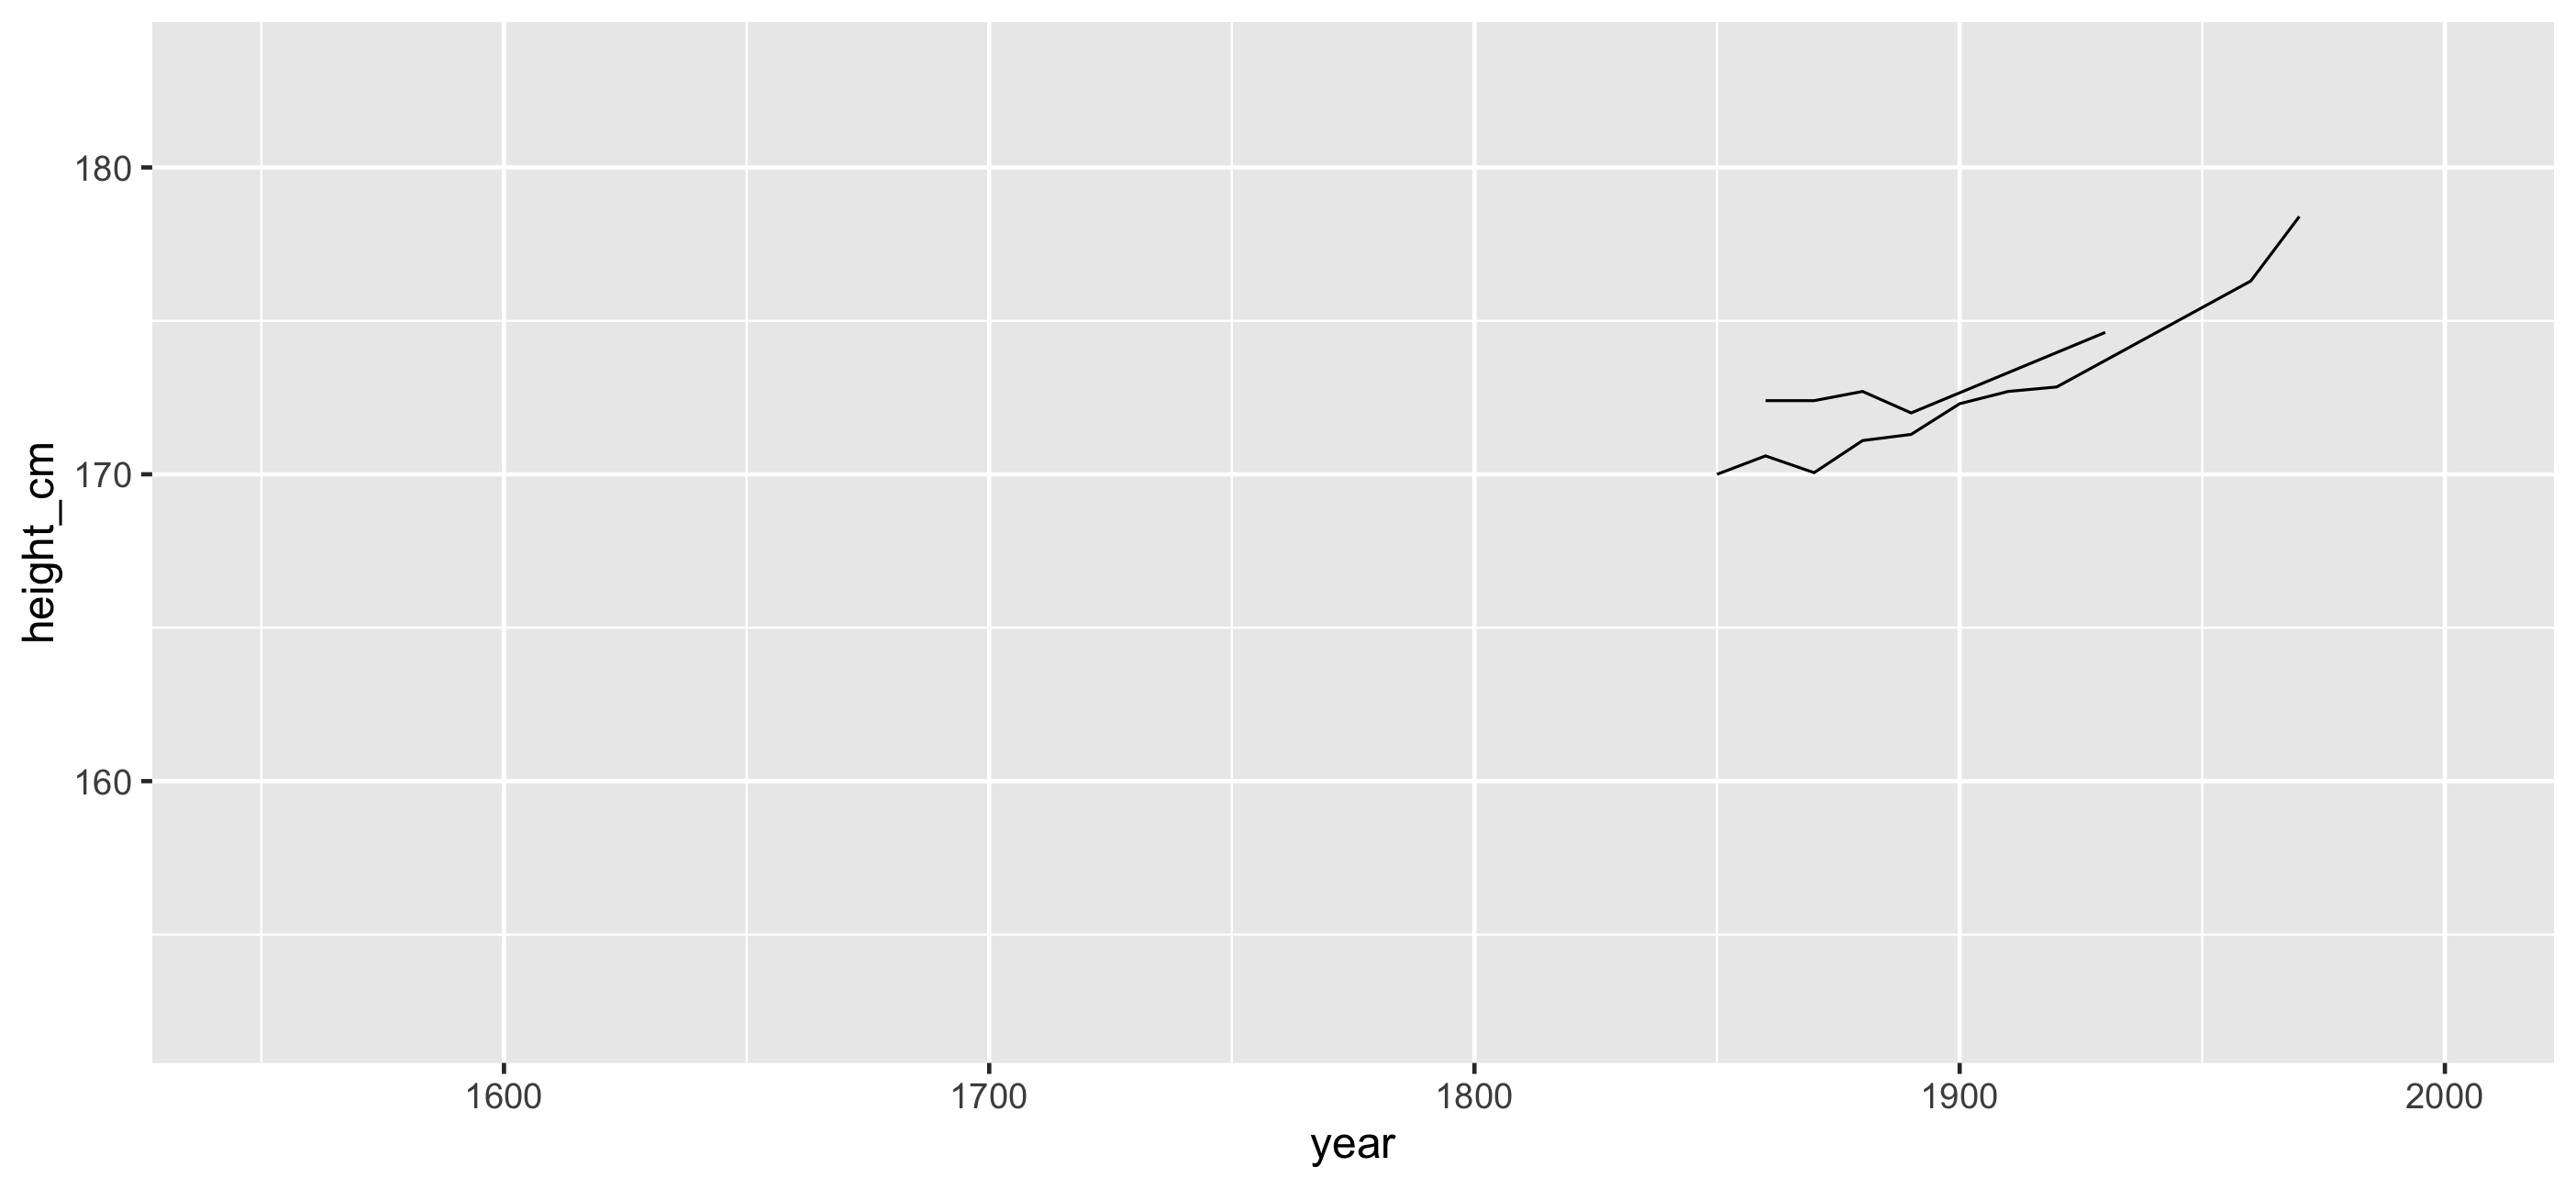
...And New Zealand
And the rest?
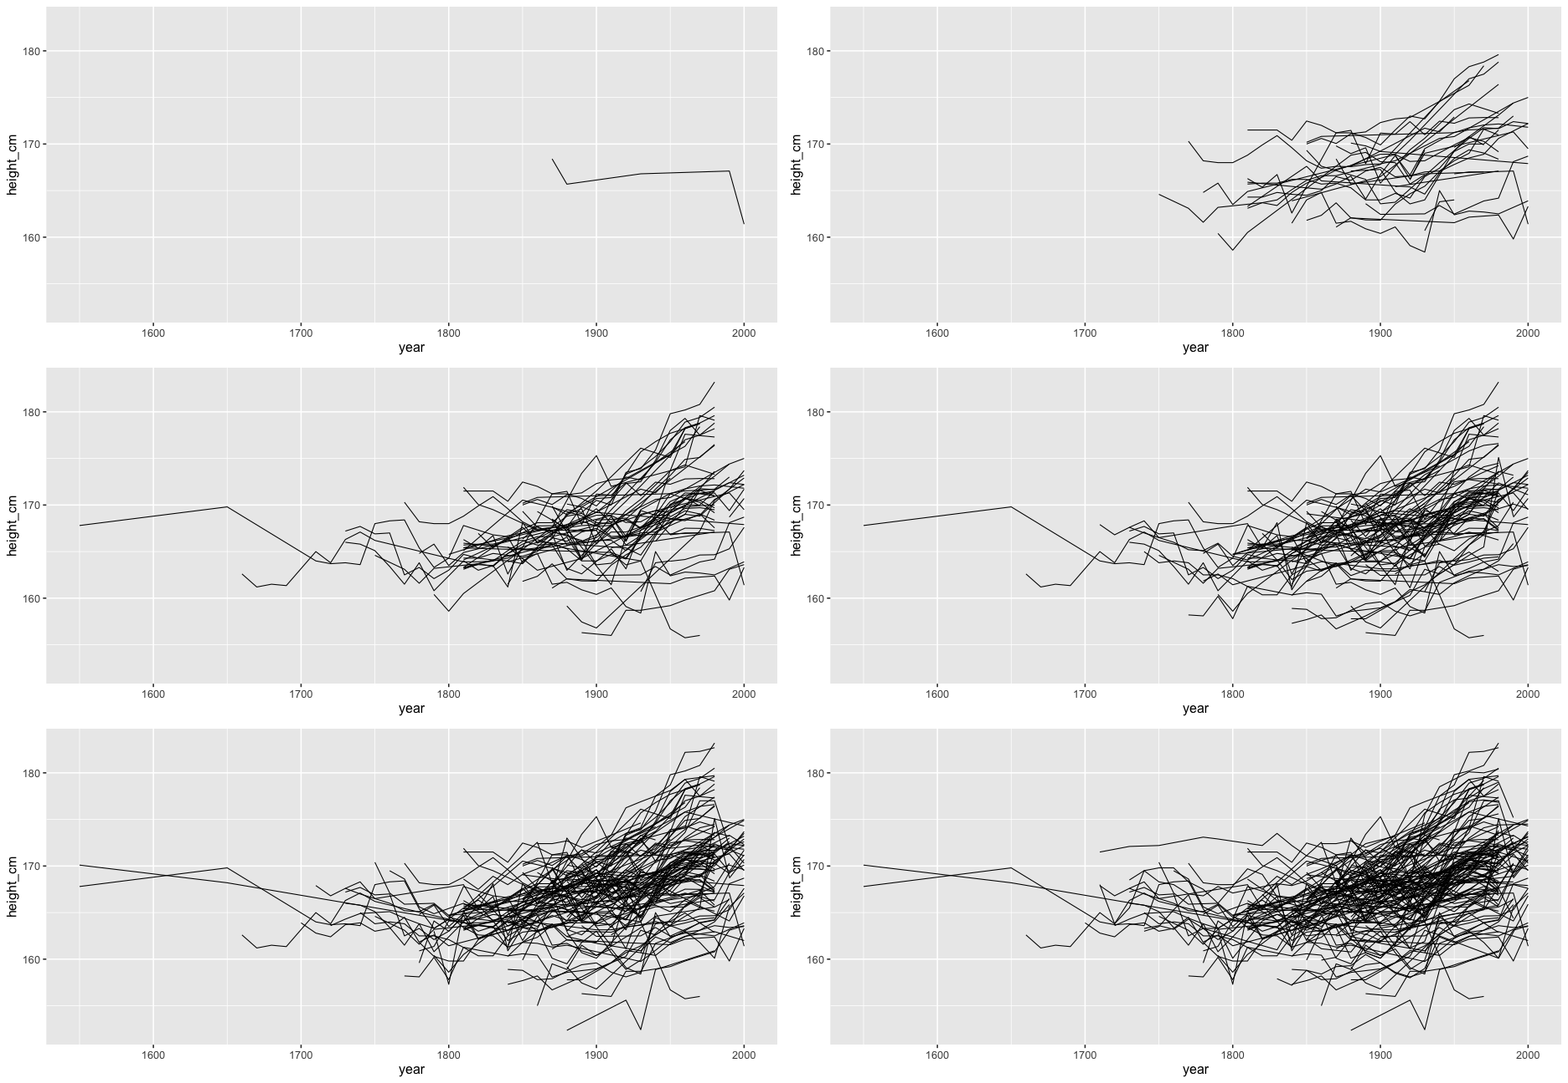
And the rest?
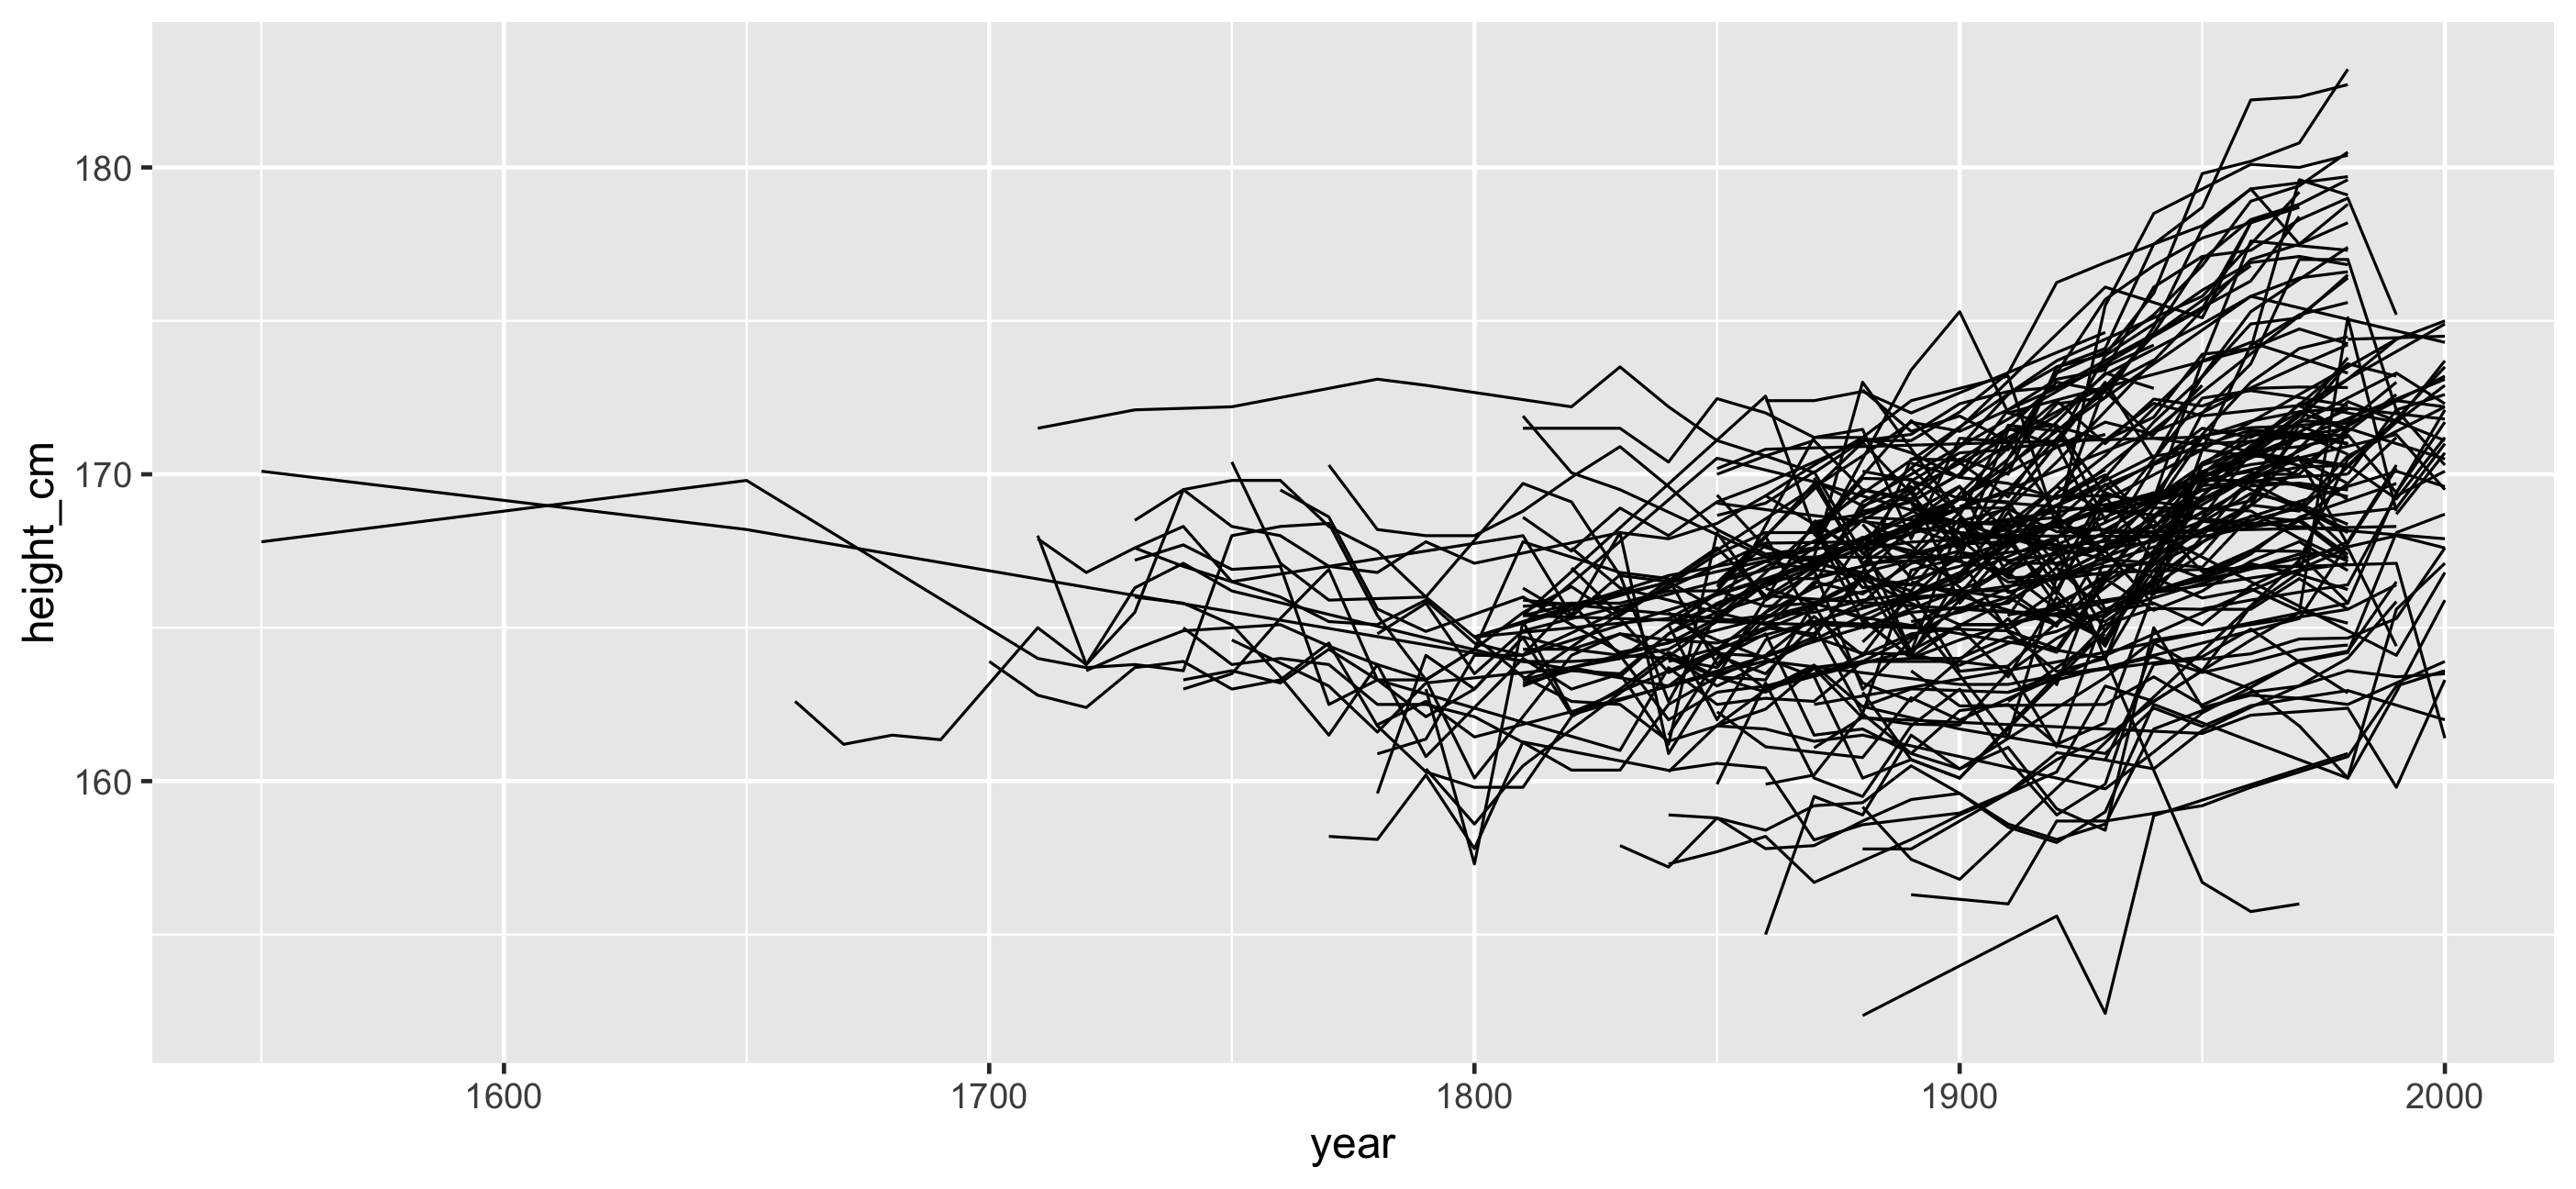
Problems:
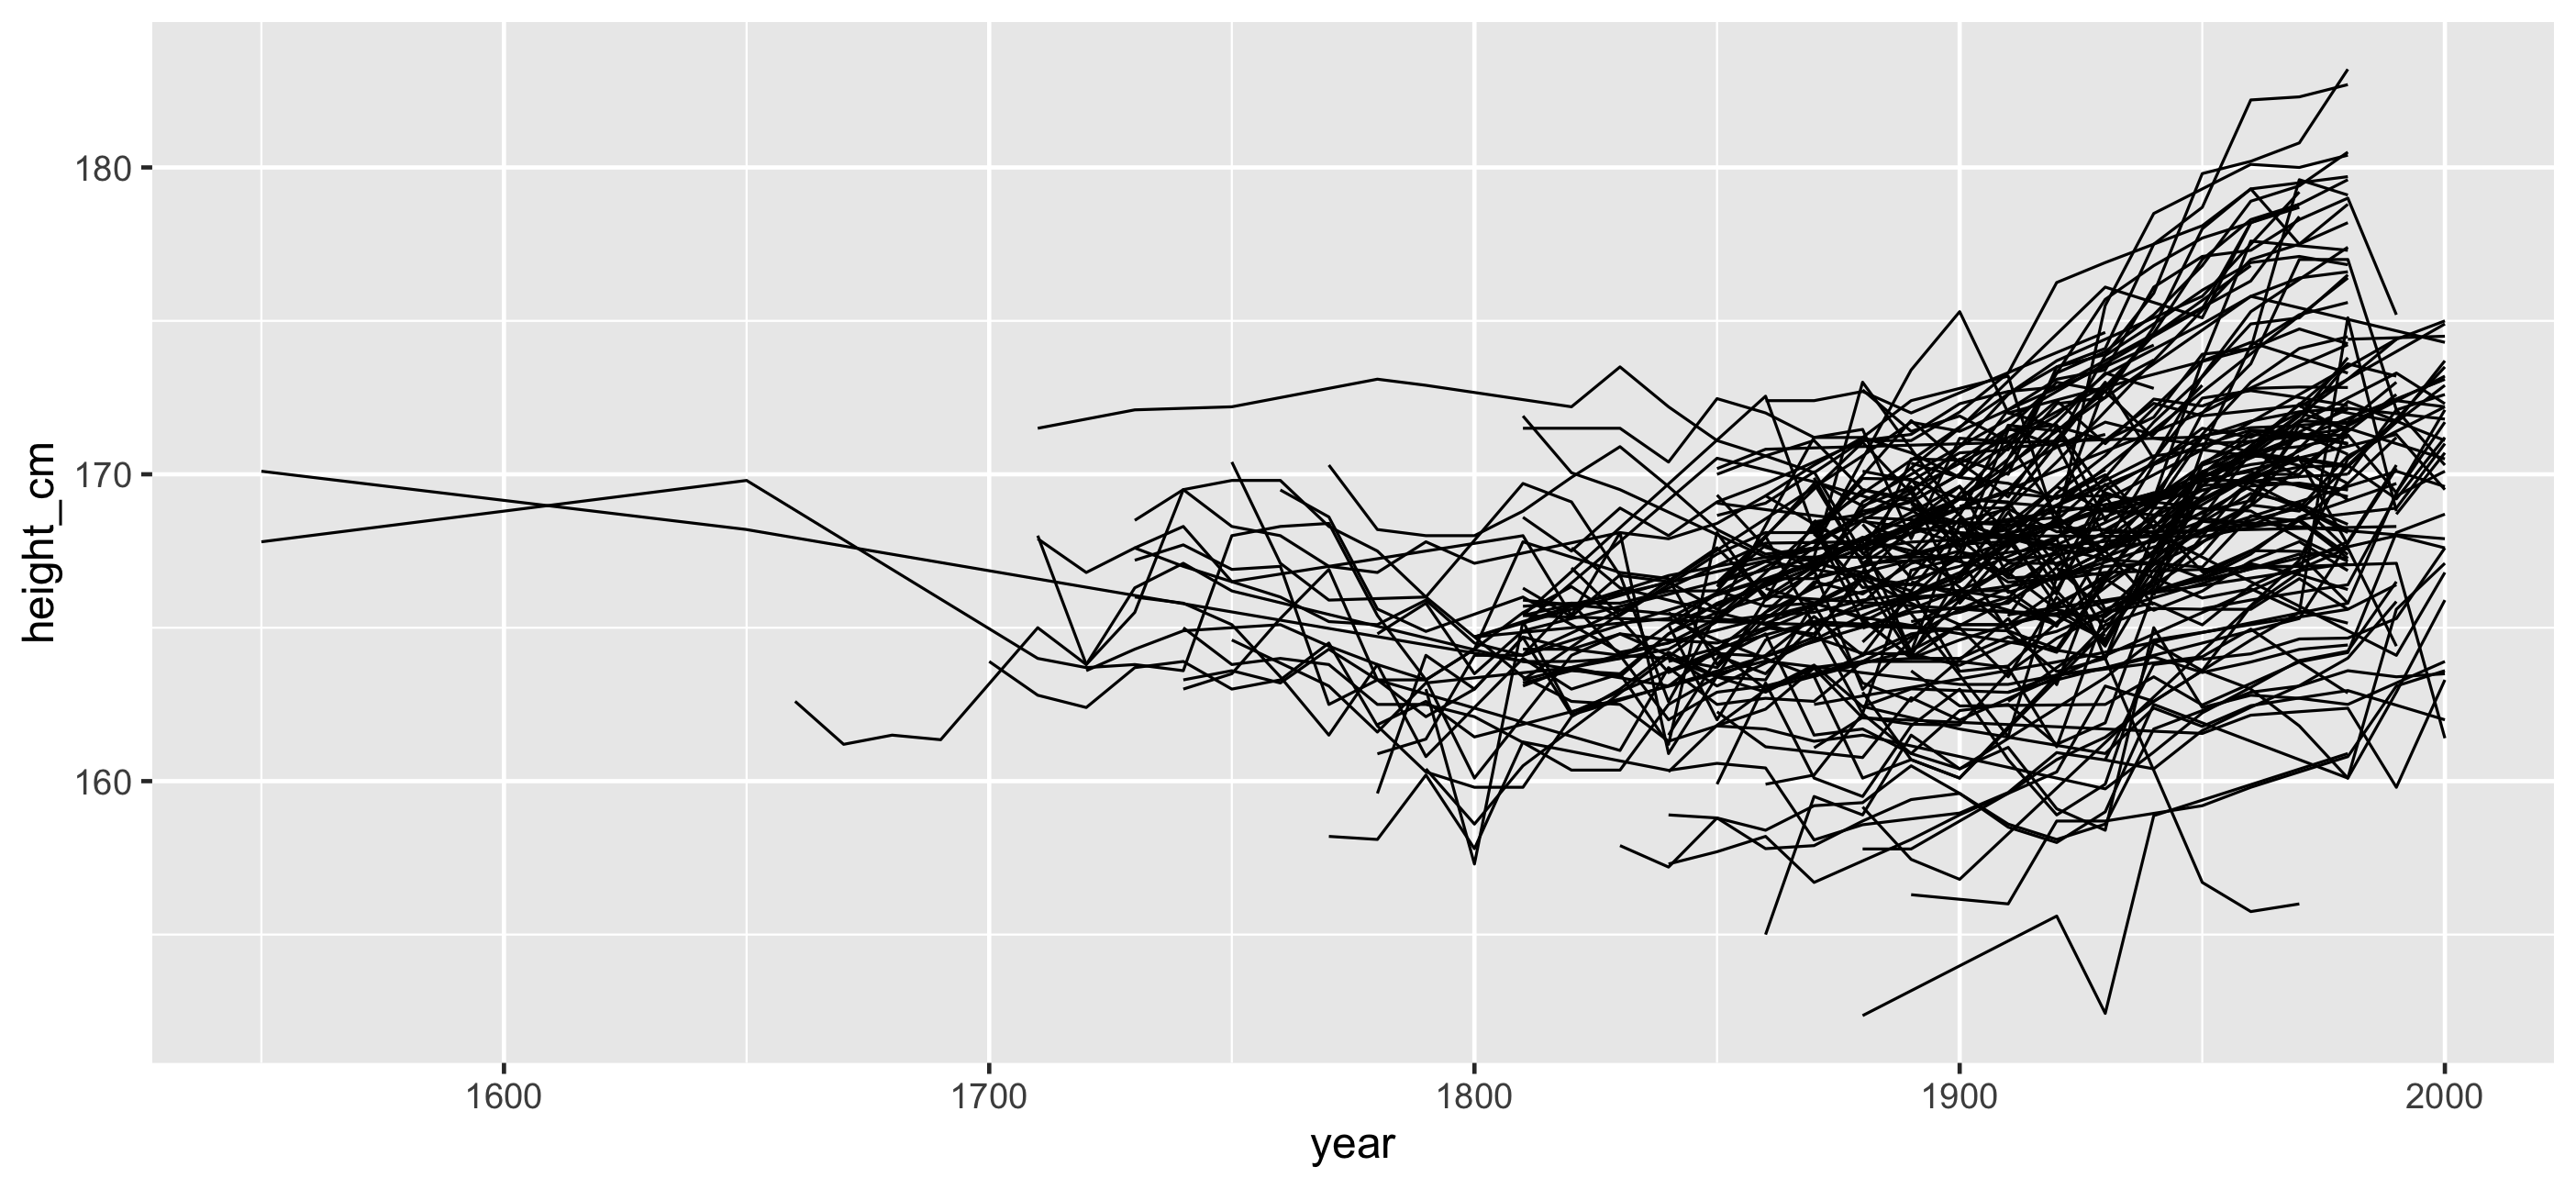
Overplotting
🙈 We don't see the individuals
🤷 Looking at 144 plots doesn't really help
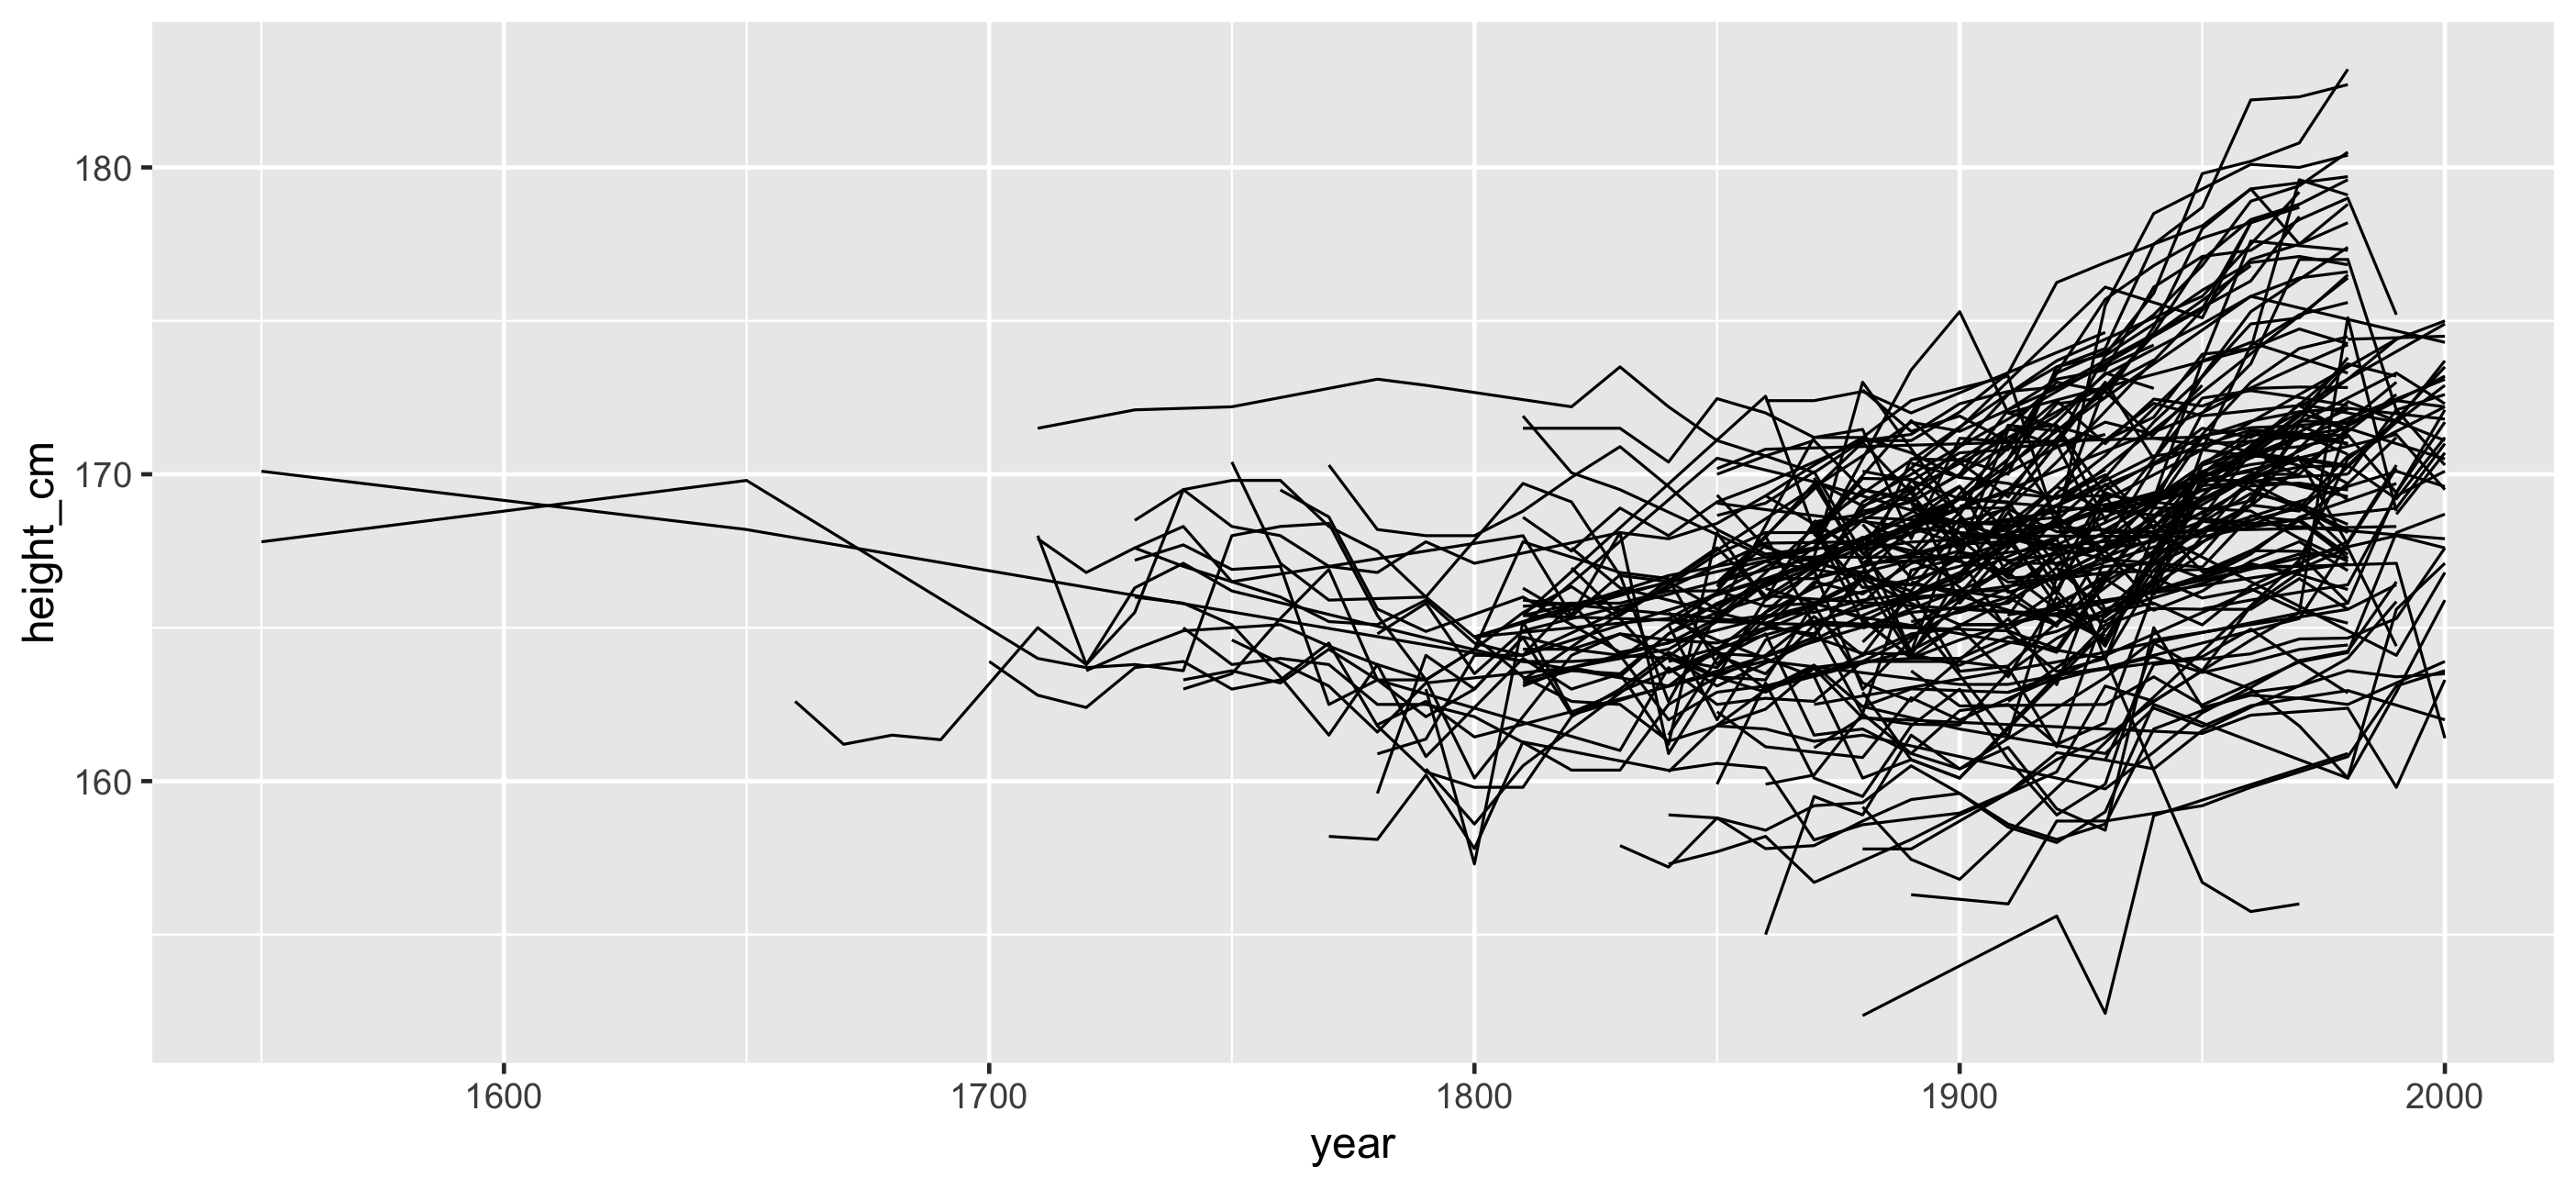
Answers: Transparency?
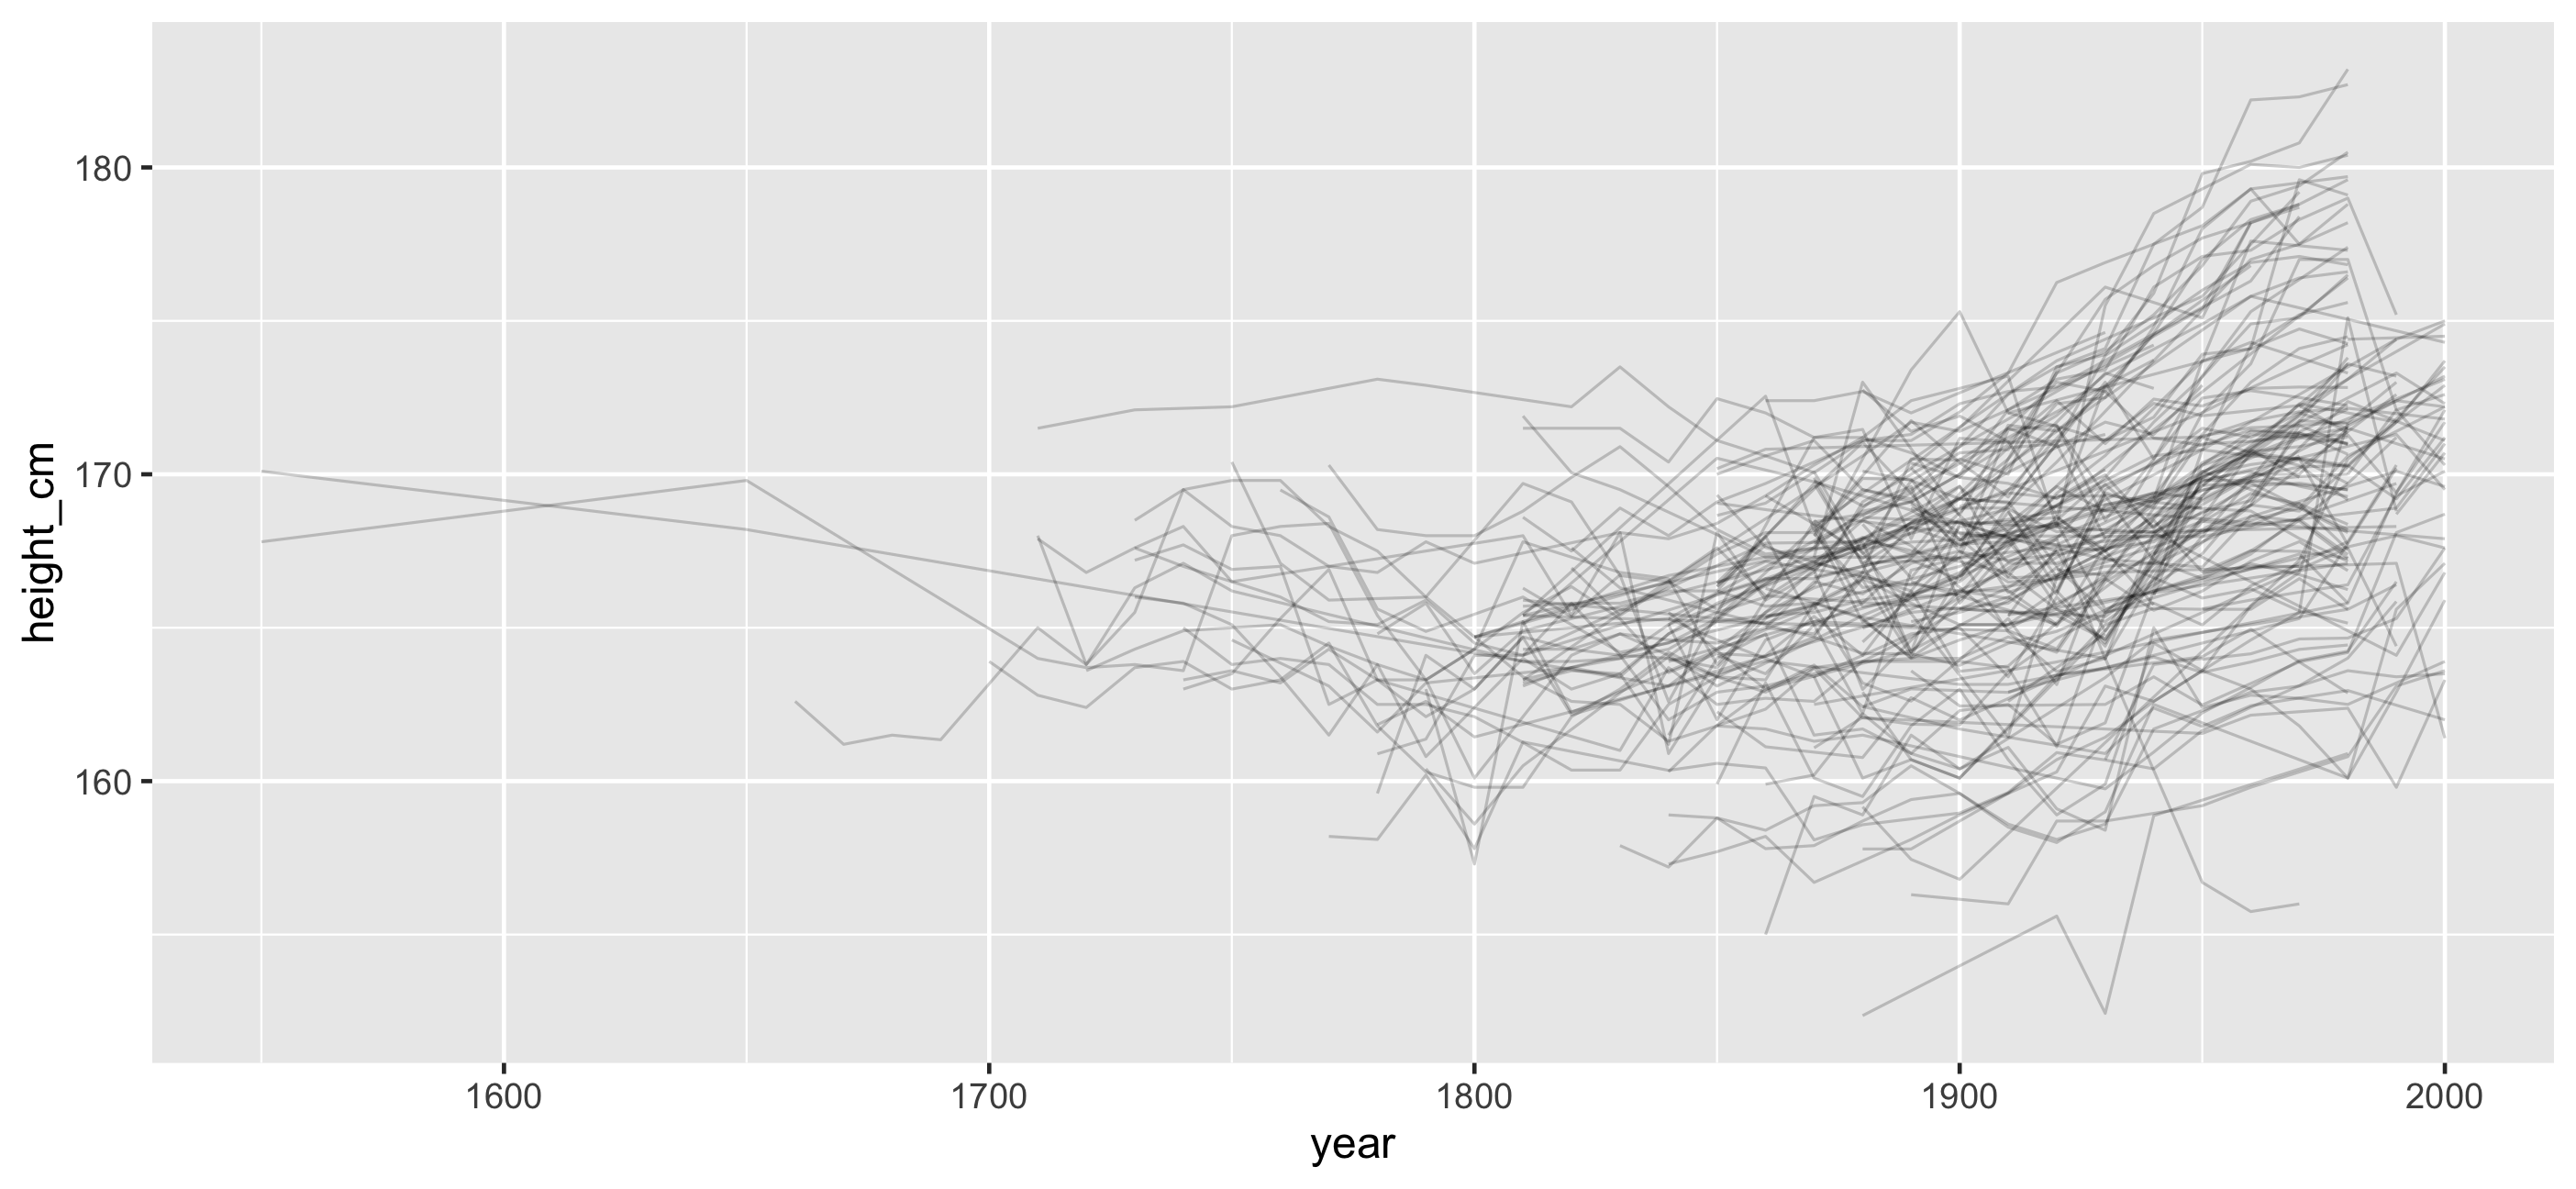
Answers: Transparency + a model?
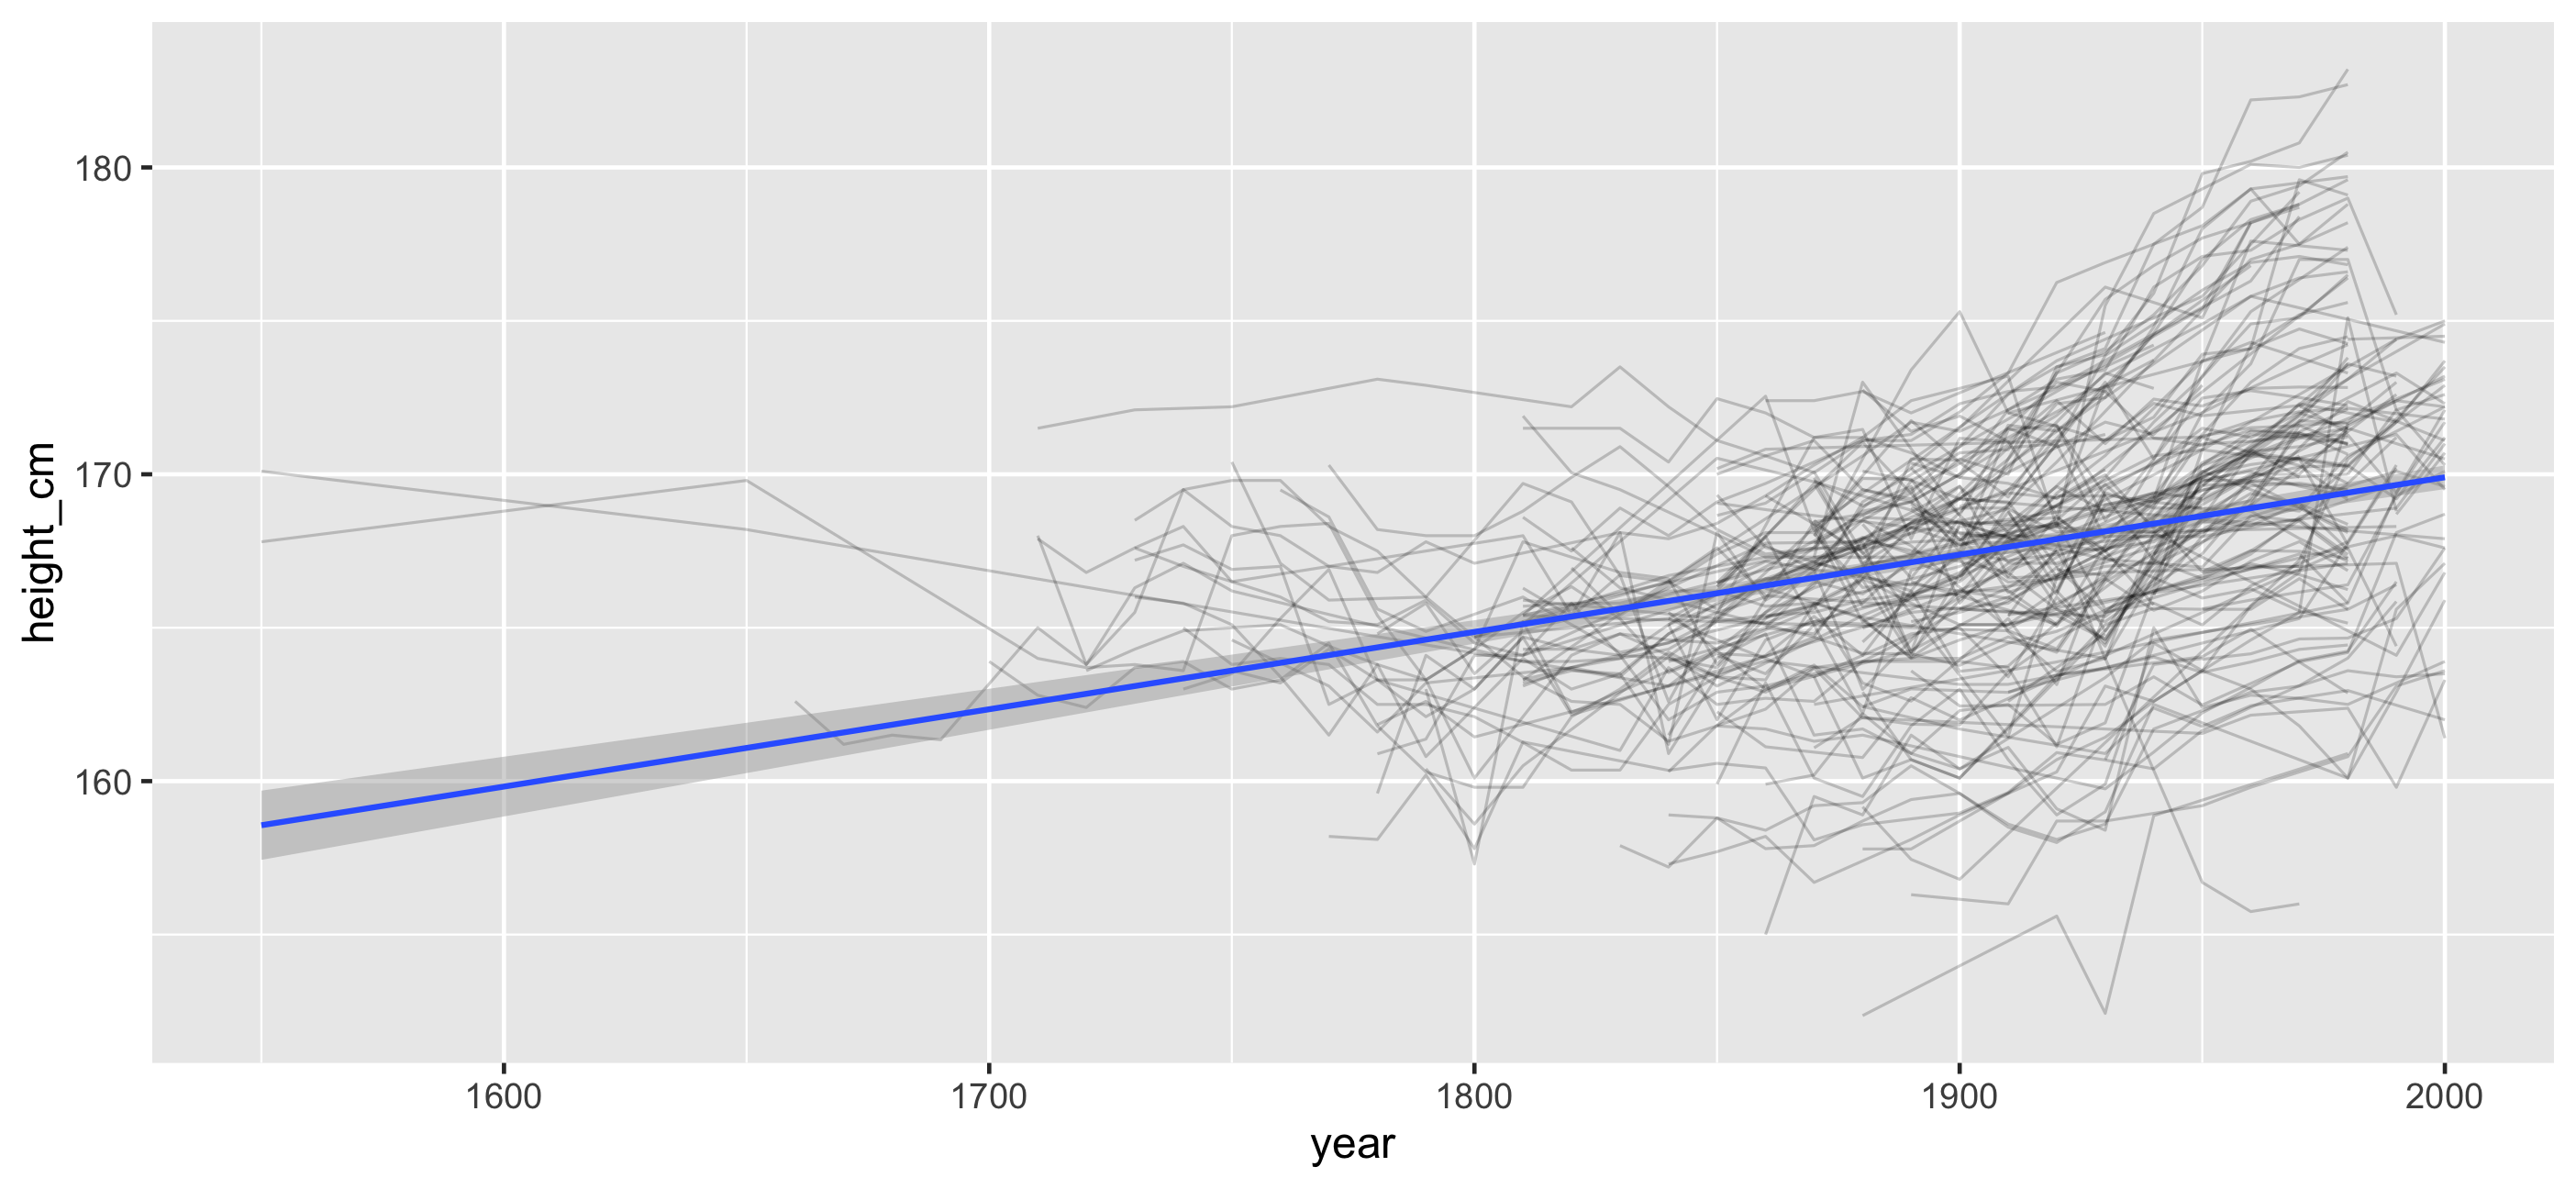
- This helps reduce the overplotting
- It's not that this is wrong, it is useful - but we lose the individuals
- We only get the overall average. We dont get the rest of the information
- How do we even get started?
But we forget about the individuals
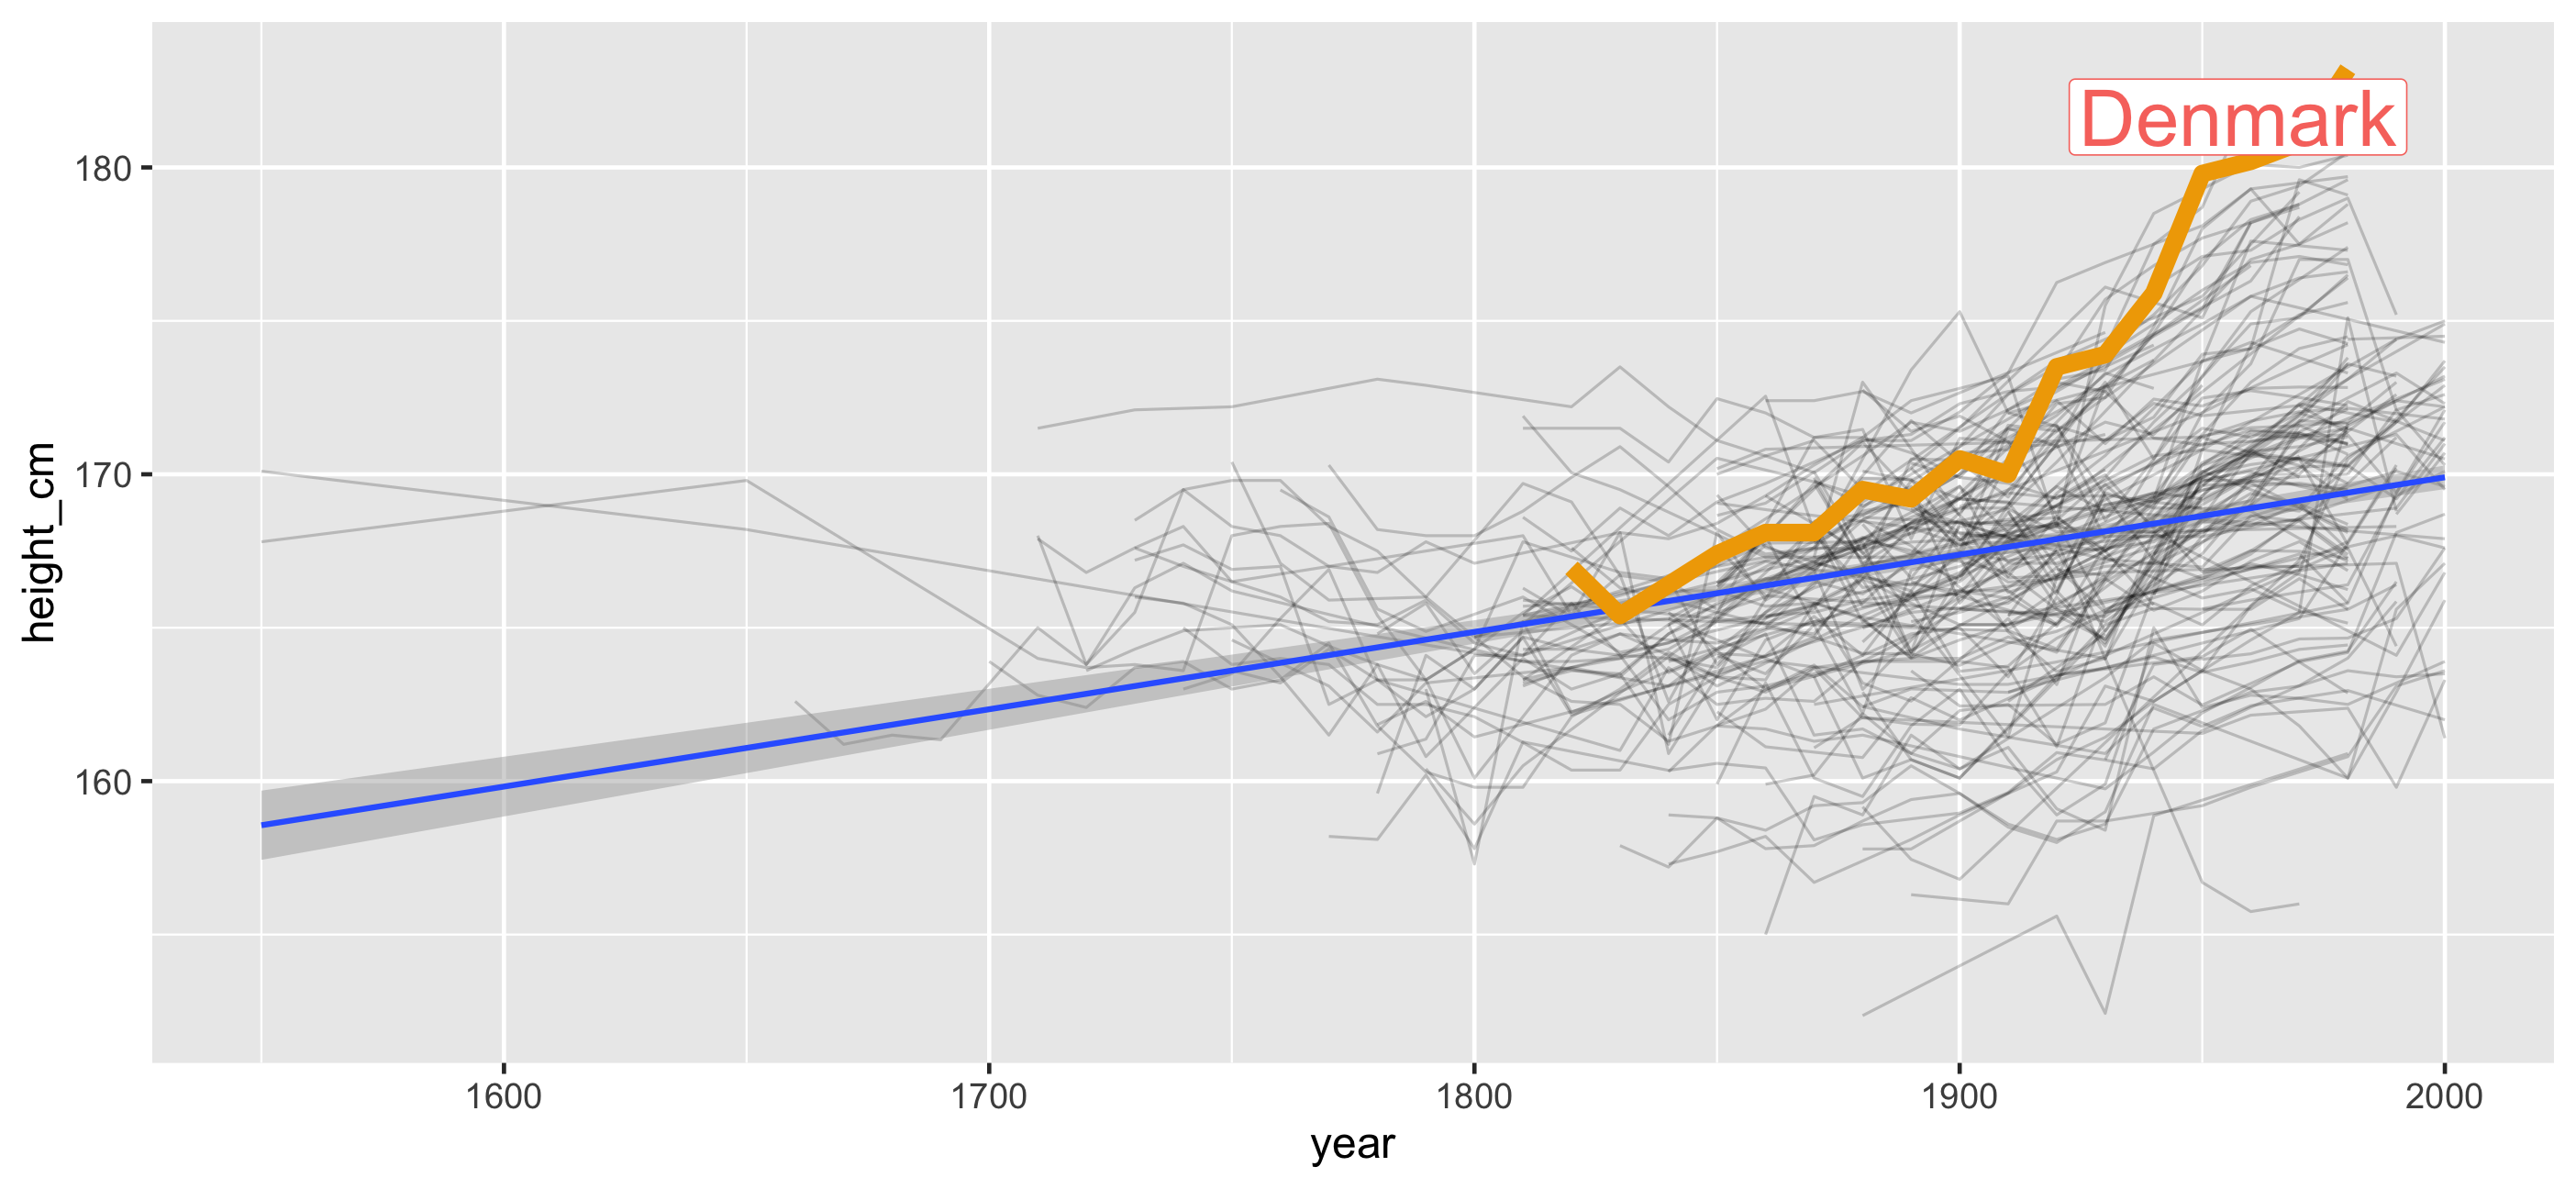
- The model might make some good overall predictions
- But it can be really ill suited for some individual
- Exploring this is somewhat clumsy - we need another way to explore
Three problems in exploring longitudinal data
Three problems in exploring longitudinal data
Problem #1: How do I look at some of the data?
Three problems in exploring longitudinal data
Problem #1: How do I look at some of the data?
Problem #2: How do I find interesting observations?
Three problems in exploring longitudinal data
Problem #1: How do I look at some of the data?
Problem #2: How do I find interesting observations?
Problem #3: How do I understand a model?
Introducing brolgar: brolgar.njtierney.com
browsing
over
longitudinal data
graphically, and
analytically, in
r
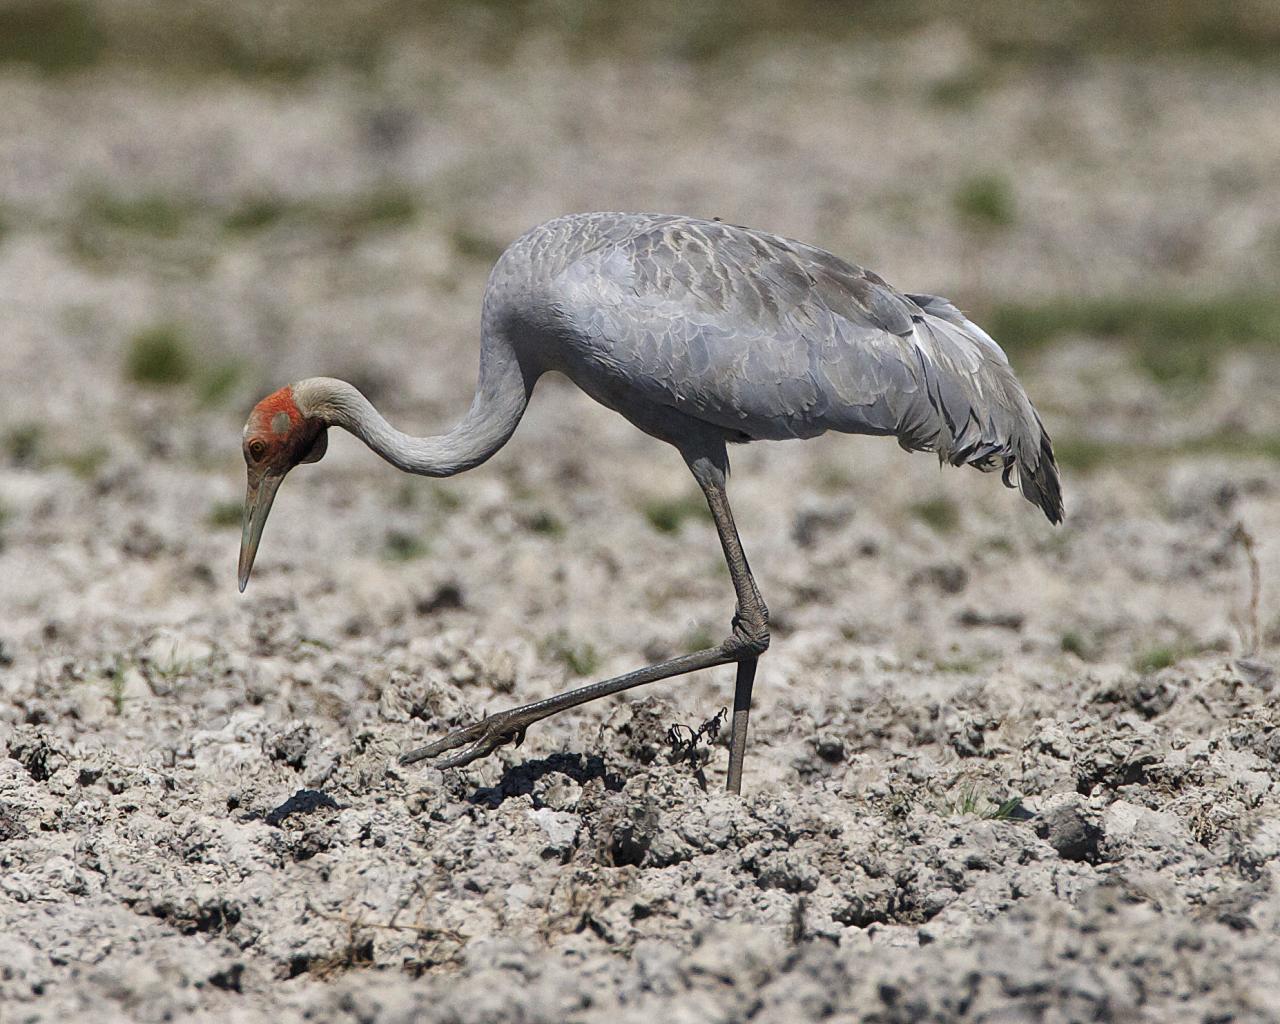
- It's a crane, it fishes, and it's a native Australian bird
What is longitudinal data?
What is longitudinal data?
Individuals repeatedly measured through time
What is longitudinal data?
Individuals repeatedly measured through time
What is longitudinal data?
Individuals repeatedly measured through time
🤔 longitudinal data as a time series?
🤔 longitudinal data as a time series?
Anything that is observed sequentially over time is a time series
🤔 longitudinal data as a time series?
Anything that is observed sequentially over time is a time series
Longitudinal data as a time series 
heights <- as_tsibble(heights, index = year, key = country, regular = FALSE)- index: Your time variable
- key: Variable(s) defining individual groups (or series)
1. + 2. determine distinct rows in a tsibble.
(From Dr. Earo Wang's talk: Melt the clock)
## # A tsibble: 1,490 x 3 [!]## # Key: country [144]## country year height_cm## <chr> <dbl> <dbl>## 1 Afghanistan 1870 168.## 2 Afghanistan 1880 166.## 3 Afghanistan 1930 167.## 4 Afghanistan 1990 167.## 5 Afghanistan 2000 161.## 6 Albania 1880 170.## # … with 1,484 more rowsLongitudinal data as a time series 
We add information about index + key:
📐 Index = Year
🔑 Key = Country
Longitudinal data as a time series 
We add information about index + key:
📐 Index = Year
🔑 Key = Country
Record important time series information once
Use it many times in other places
Problem #1: How do I look at some of the data?
Problem #1: How do I look at some of the data?
How do you eat spaghetti?




data indigestion



Portion out your spaghetti! 🍝 🍝 🍝 🍝
Look at one set of subsamples 🍝
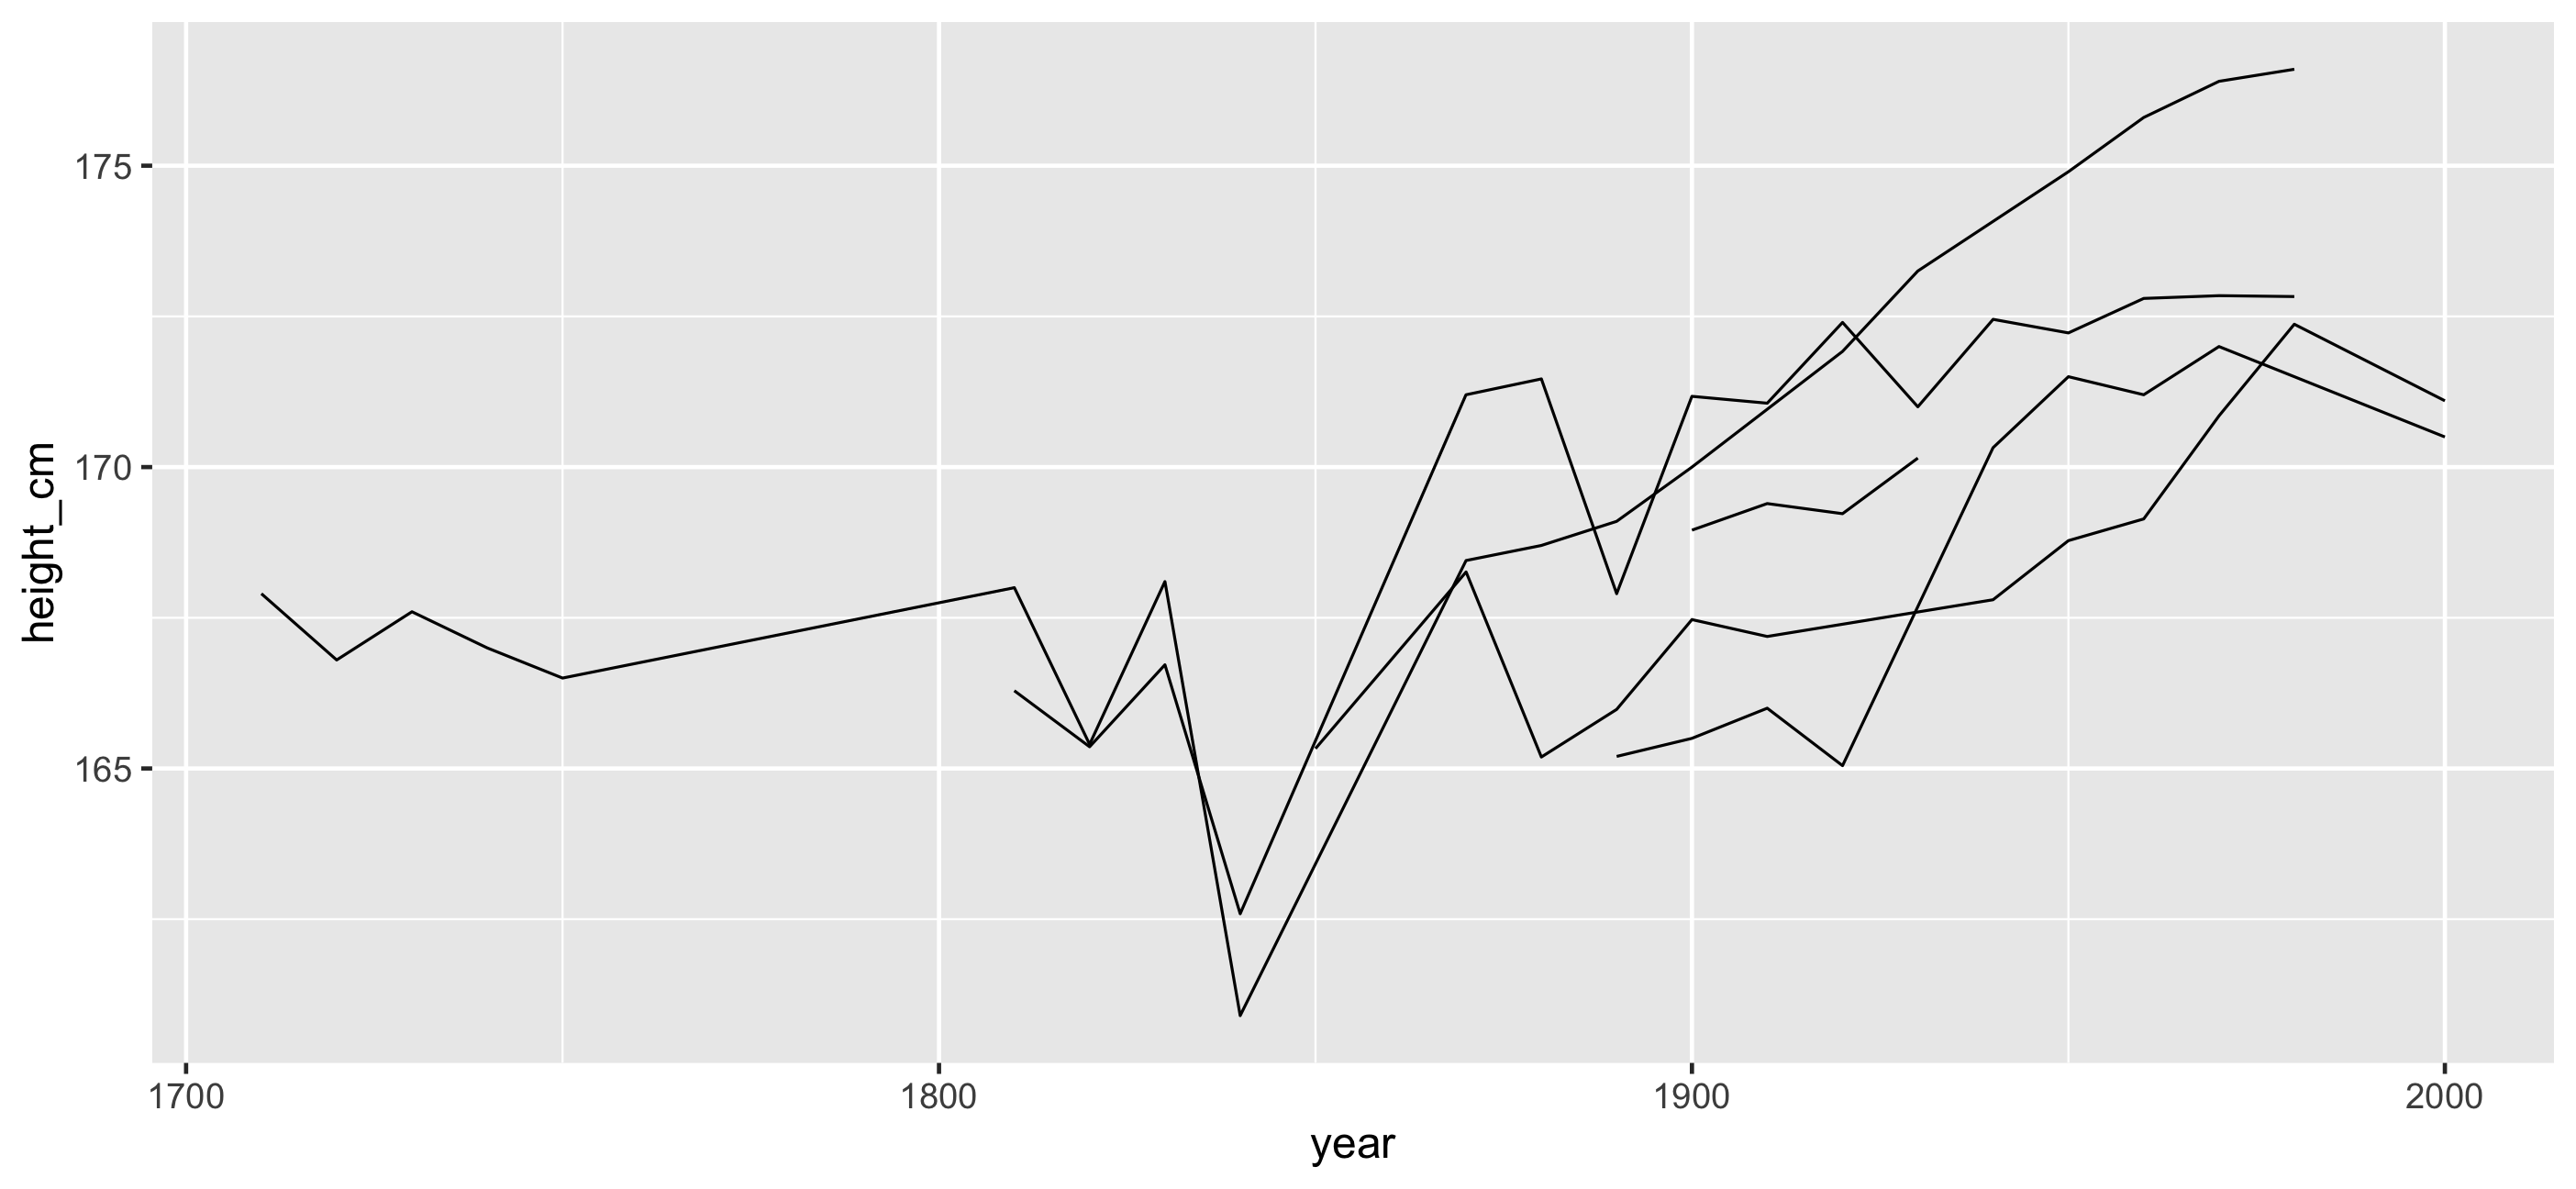
Look at many subsamples 🍝 🍝 🍝 🍝 🍝 🍝
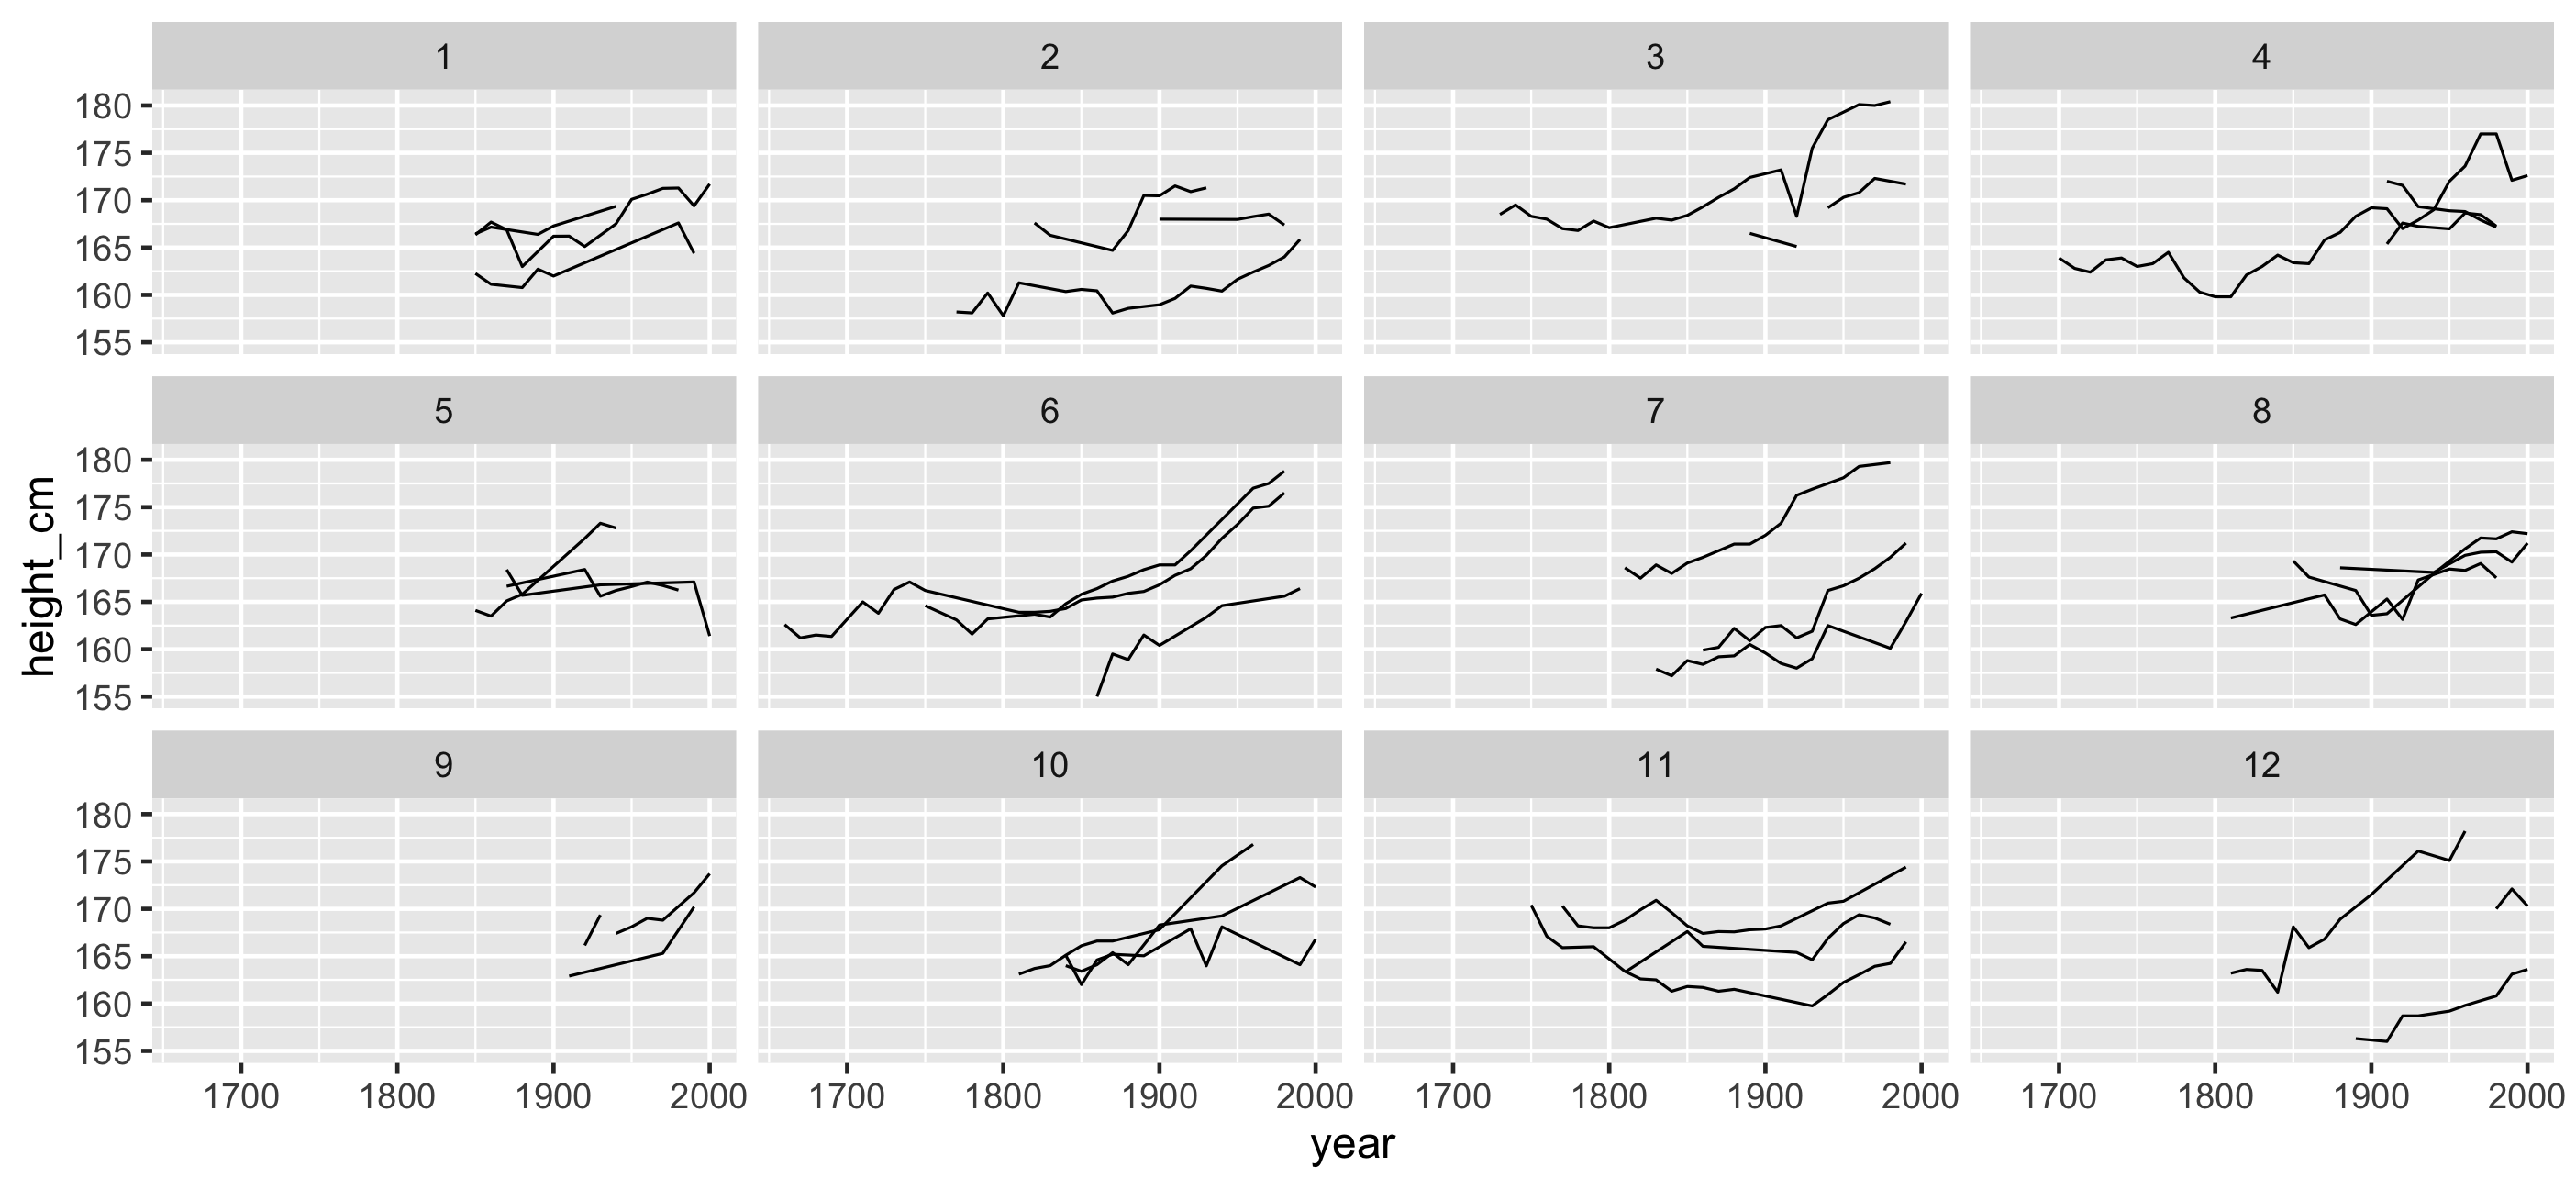
How do I look at many subsamples? 🤔
How do I look at many subsamples? 🤔
How many keys are there?
How do I look at many subsamples? 🤔
How many keys are there?
How many facets do I want?
How do I look at many subsamples? 🤔
How many keys are there?
How many facets do I want?
How many keys per facet?
How do I look at many subsamples? 🤔
How to keep the same number of keys per plot?
How do I look at many subsamples? 🤔
How to keep the same number of keys per plot?
What is rep, rep.int, and rep_len?
How do I look at many subsamples? 🤔
How to keep the same number of keys per plot?
What is rep, rep.int, and rep_len?
Do I want length.out or times?
Distraction threshold ⏲ 🐰 🕳
Distraction threshold ⏲ 🐰 🕳
(Something I made up)
Distraction threshold ⏲ 🐰 🕳
(Something I made up)
If solving a problem requires solving 3+ smaller problems
Your focus shifts from the current goal to something else.
You are distracted.
Task one
Task one being overshadowed slightly by minor task 1
- Task one being overshadowed slightly by minor task 2
- Task one being overshadowed slightly by minor task 3
Avoiding the rabbit hole
Avoiding the rabbit hole
We can blame ourselves when we are distracted for not being better.
Avoiding the rabbit hole
We can blame ourselves when we are distracted for not being better.
It's not that we should be better, rather with better tools we could be more efficient.
Avoiding the rabbit hole
We can blame ourselves when we are distracted for not being better.
It's not that we should be better, rather with better tools we could be more efficient.
We need to make things as easy as reasonable, with the least amount of distraction.
facet_sample(): See more individuals 👀
ggplot(heights, aes(x = year, y = height_cm, group = country)) + geom_line()facet_sample(): See more individuals 👀
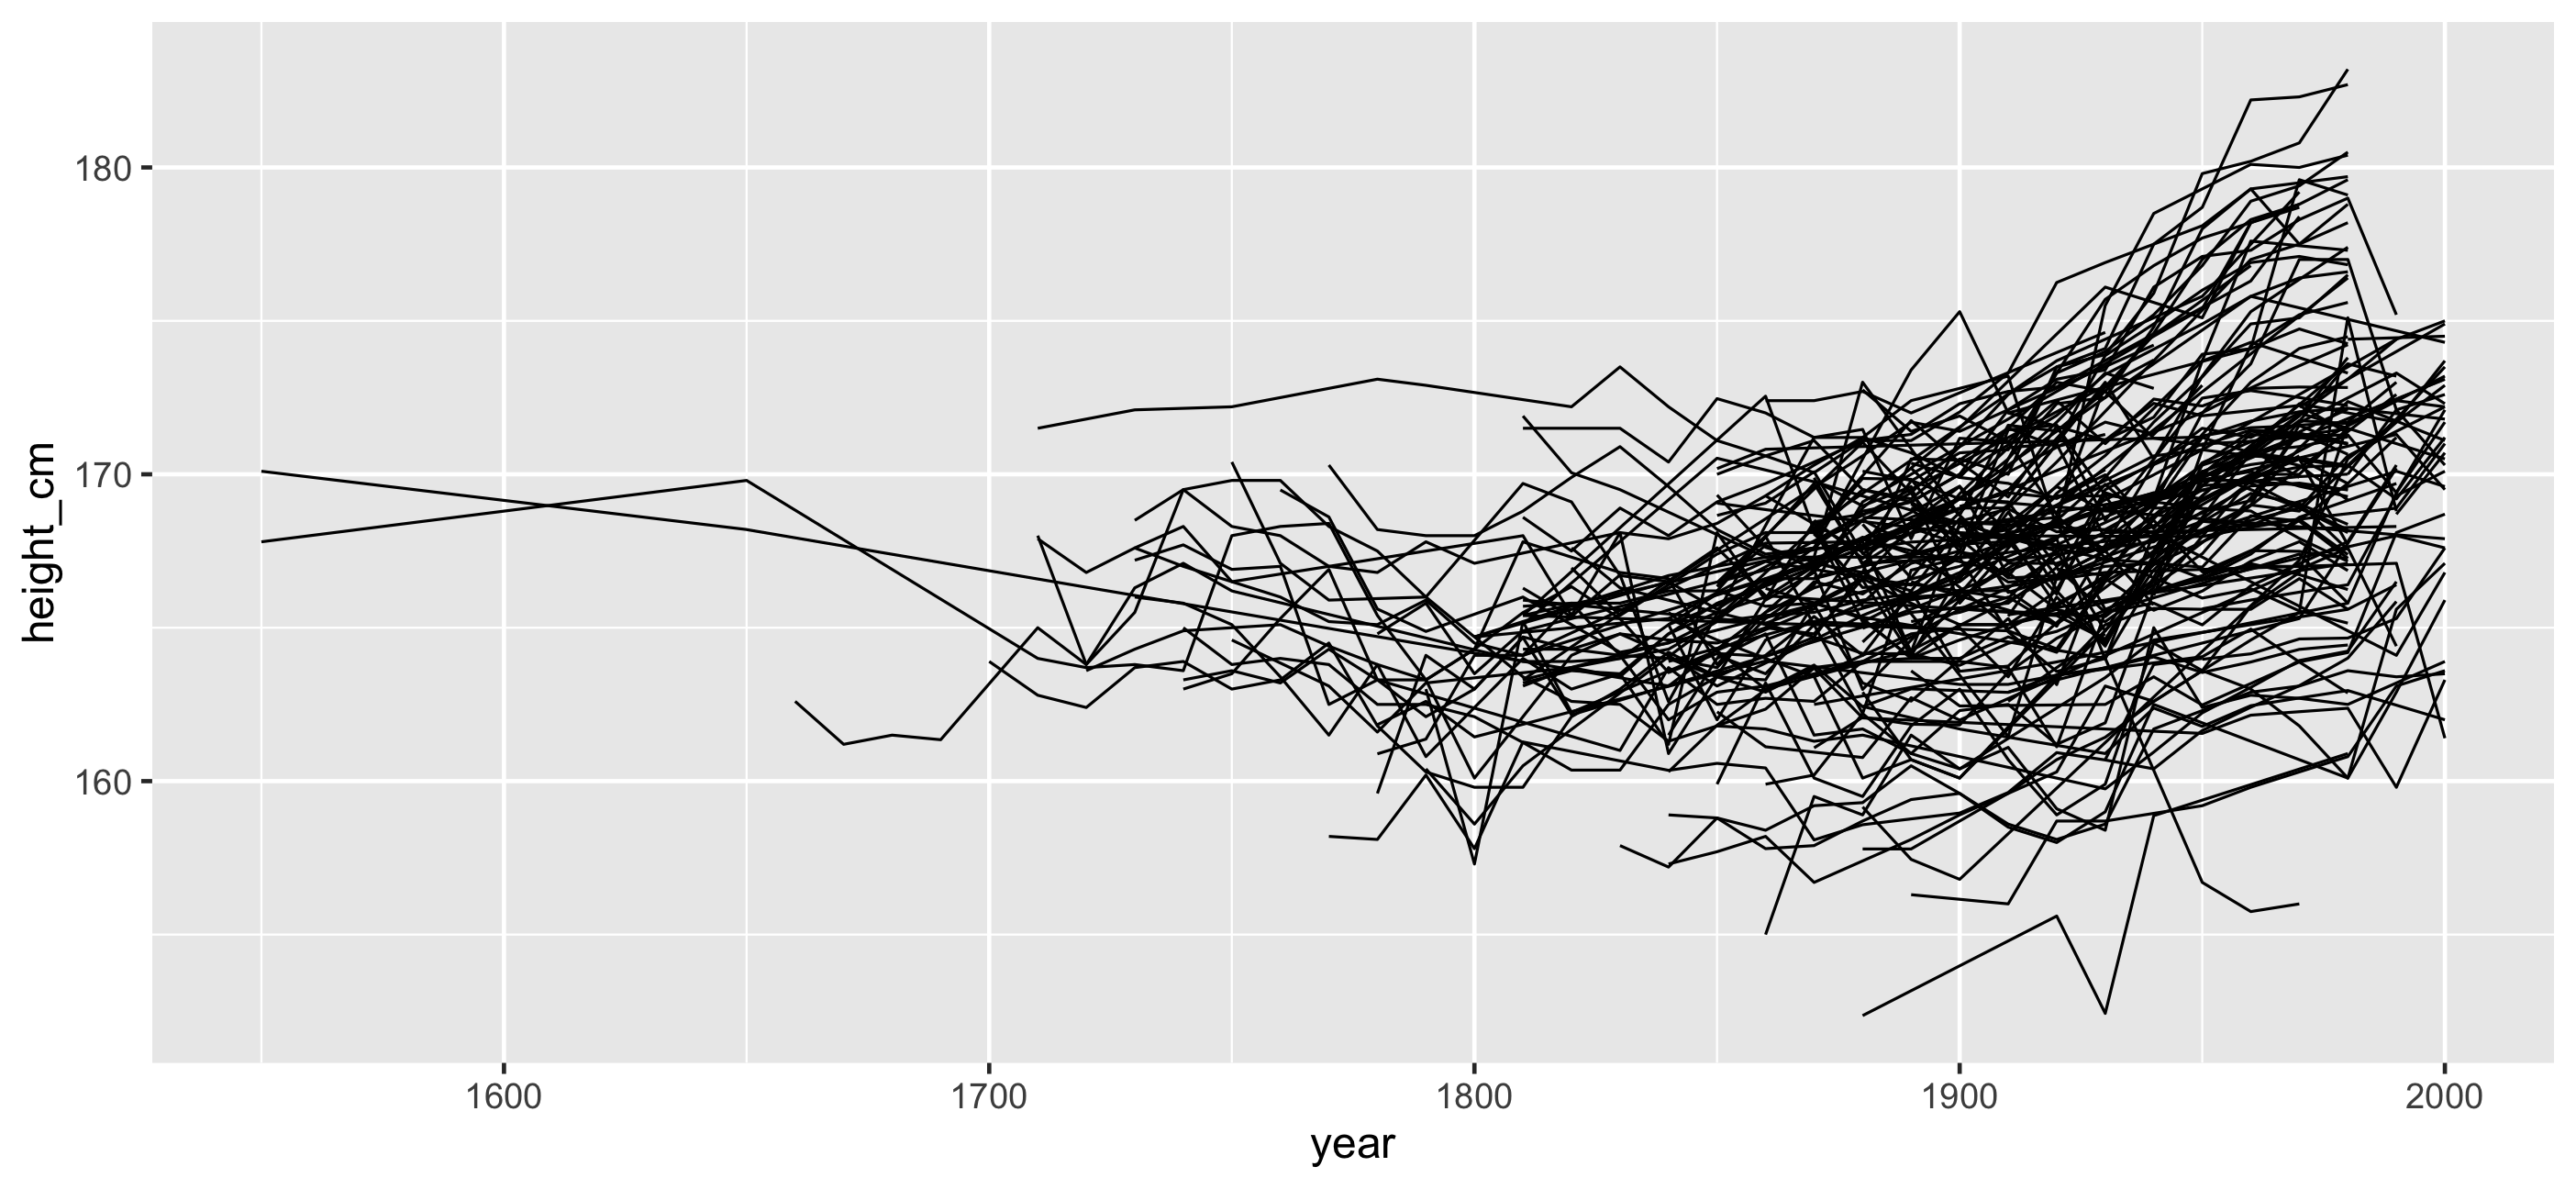
facet_sample(): See more individuals 👀
facet_sample(): See more individuals 👀
ggplot(heights, aes(x = year, y = height_cm, group = country)) + geom_line() + facet_sample()facet_sample(): See more individuals 👀
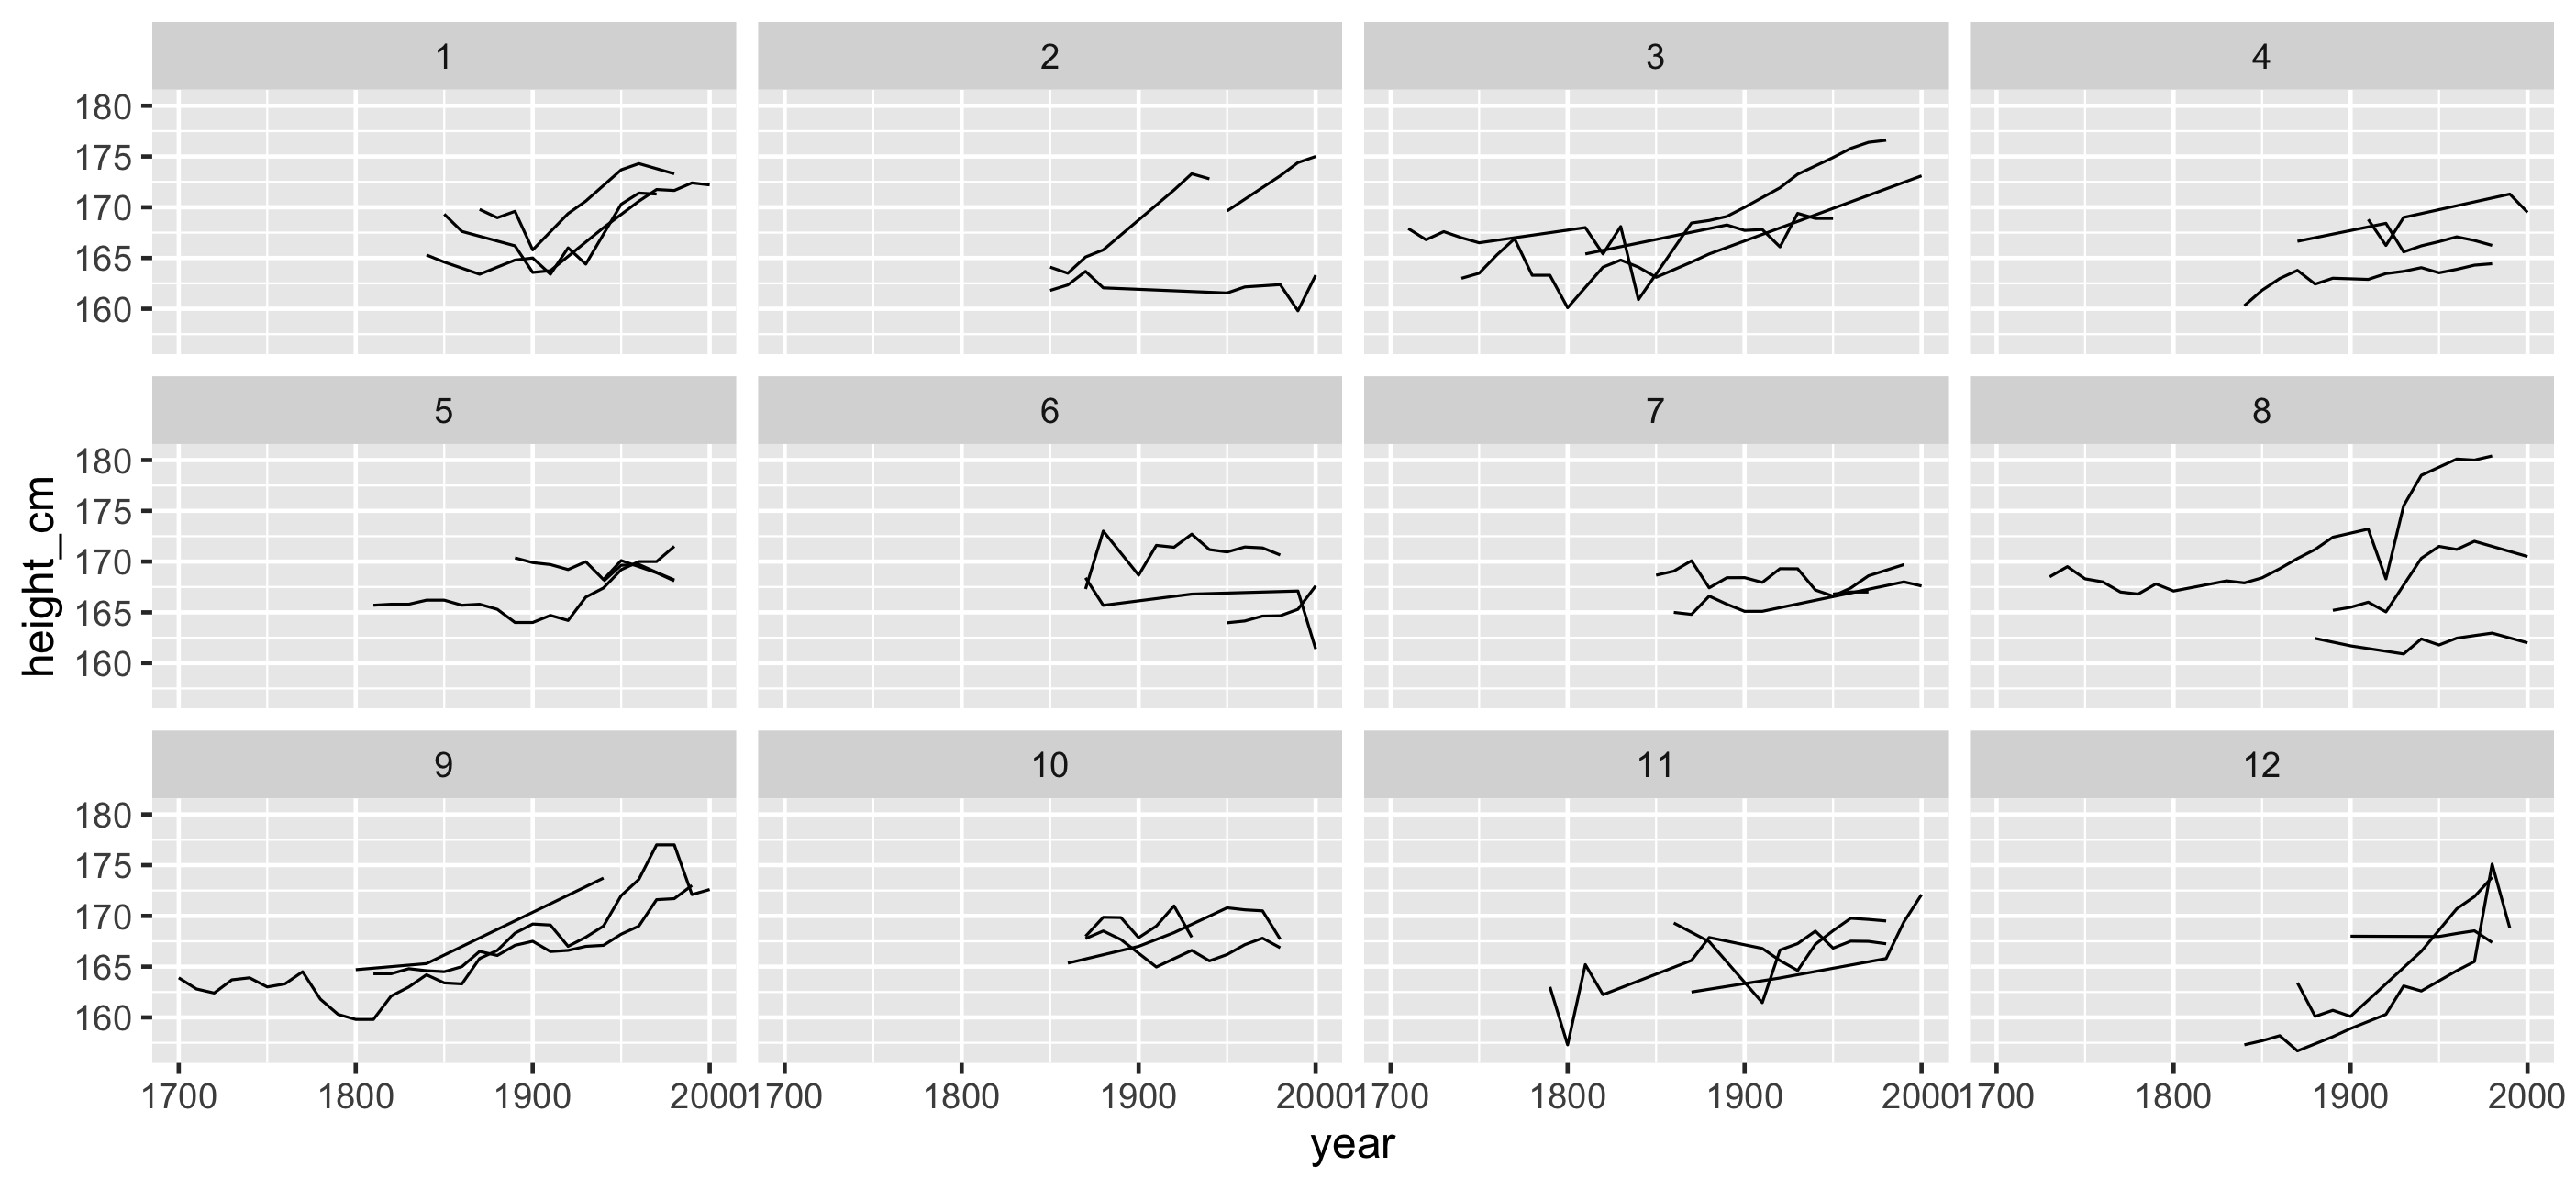
Remove distraction. Ask relevant questions
How many keys per facet?
How many plots do I want to look at?
Remove distraction. Ask relevant questions
How many keys per facet?
How many plots do I want to look at?
gg_heights + facet_sample( n_per_facet = 3, n_facets = 9 )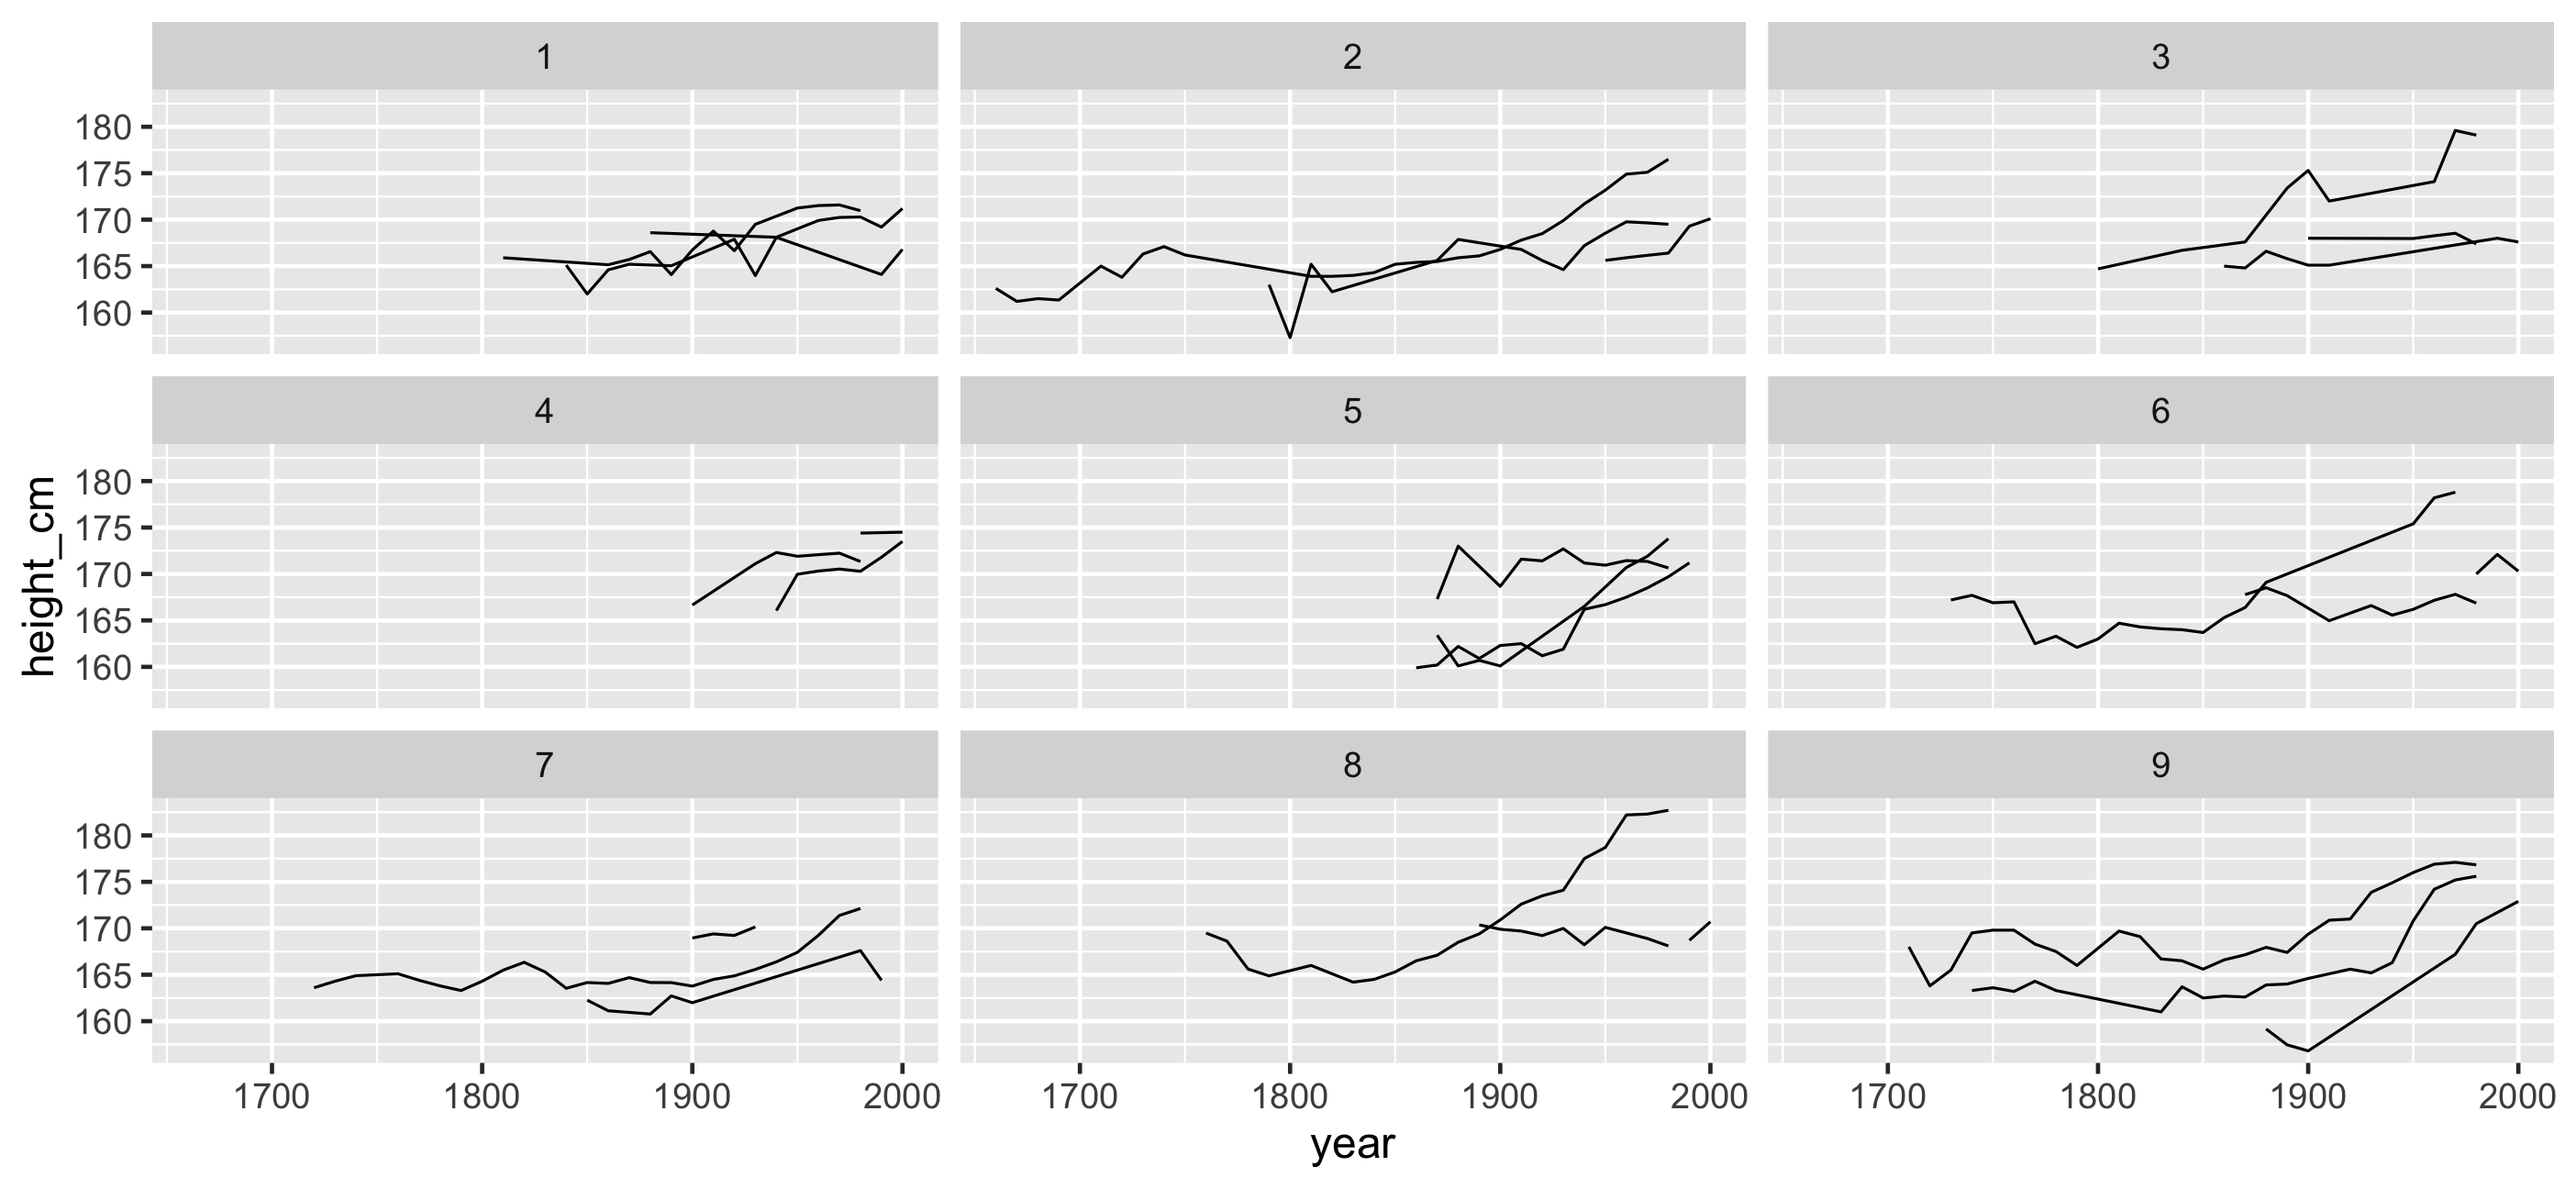
How to see all individuals?
gg_heights + facet_strata()facet_strata(): See all individuals
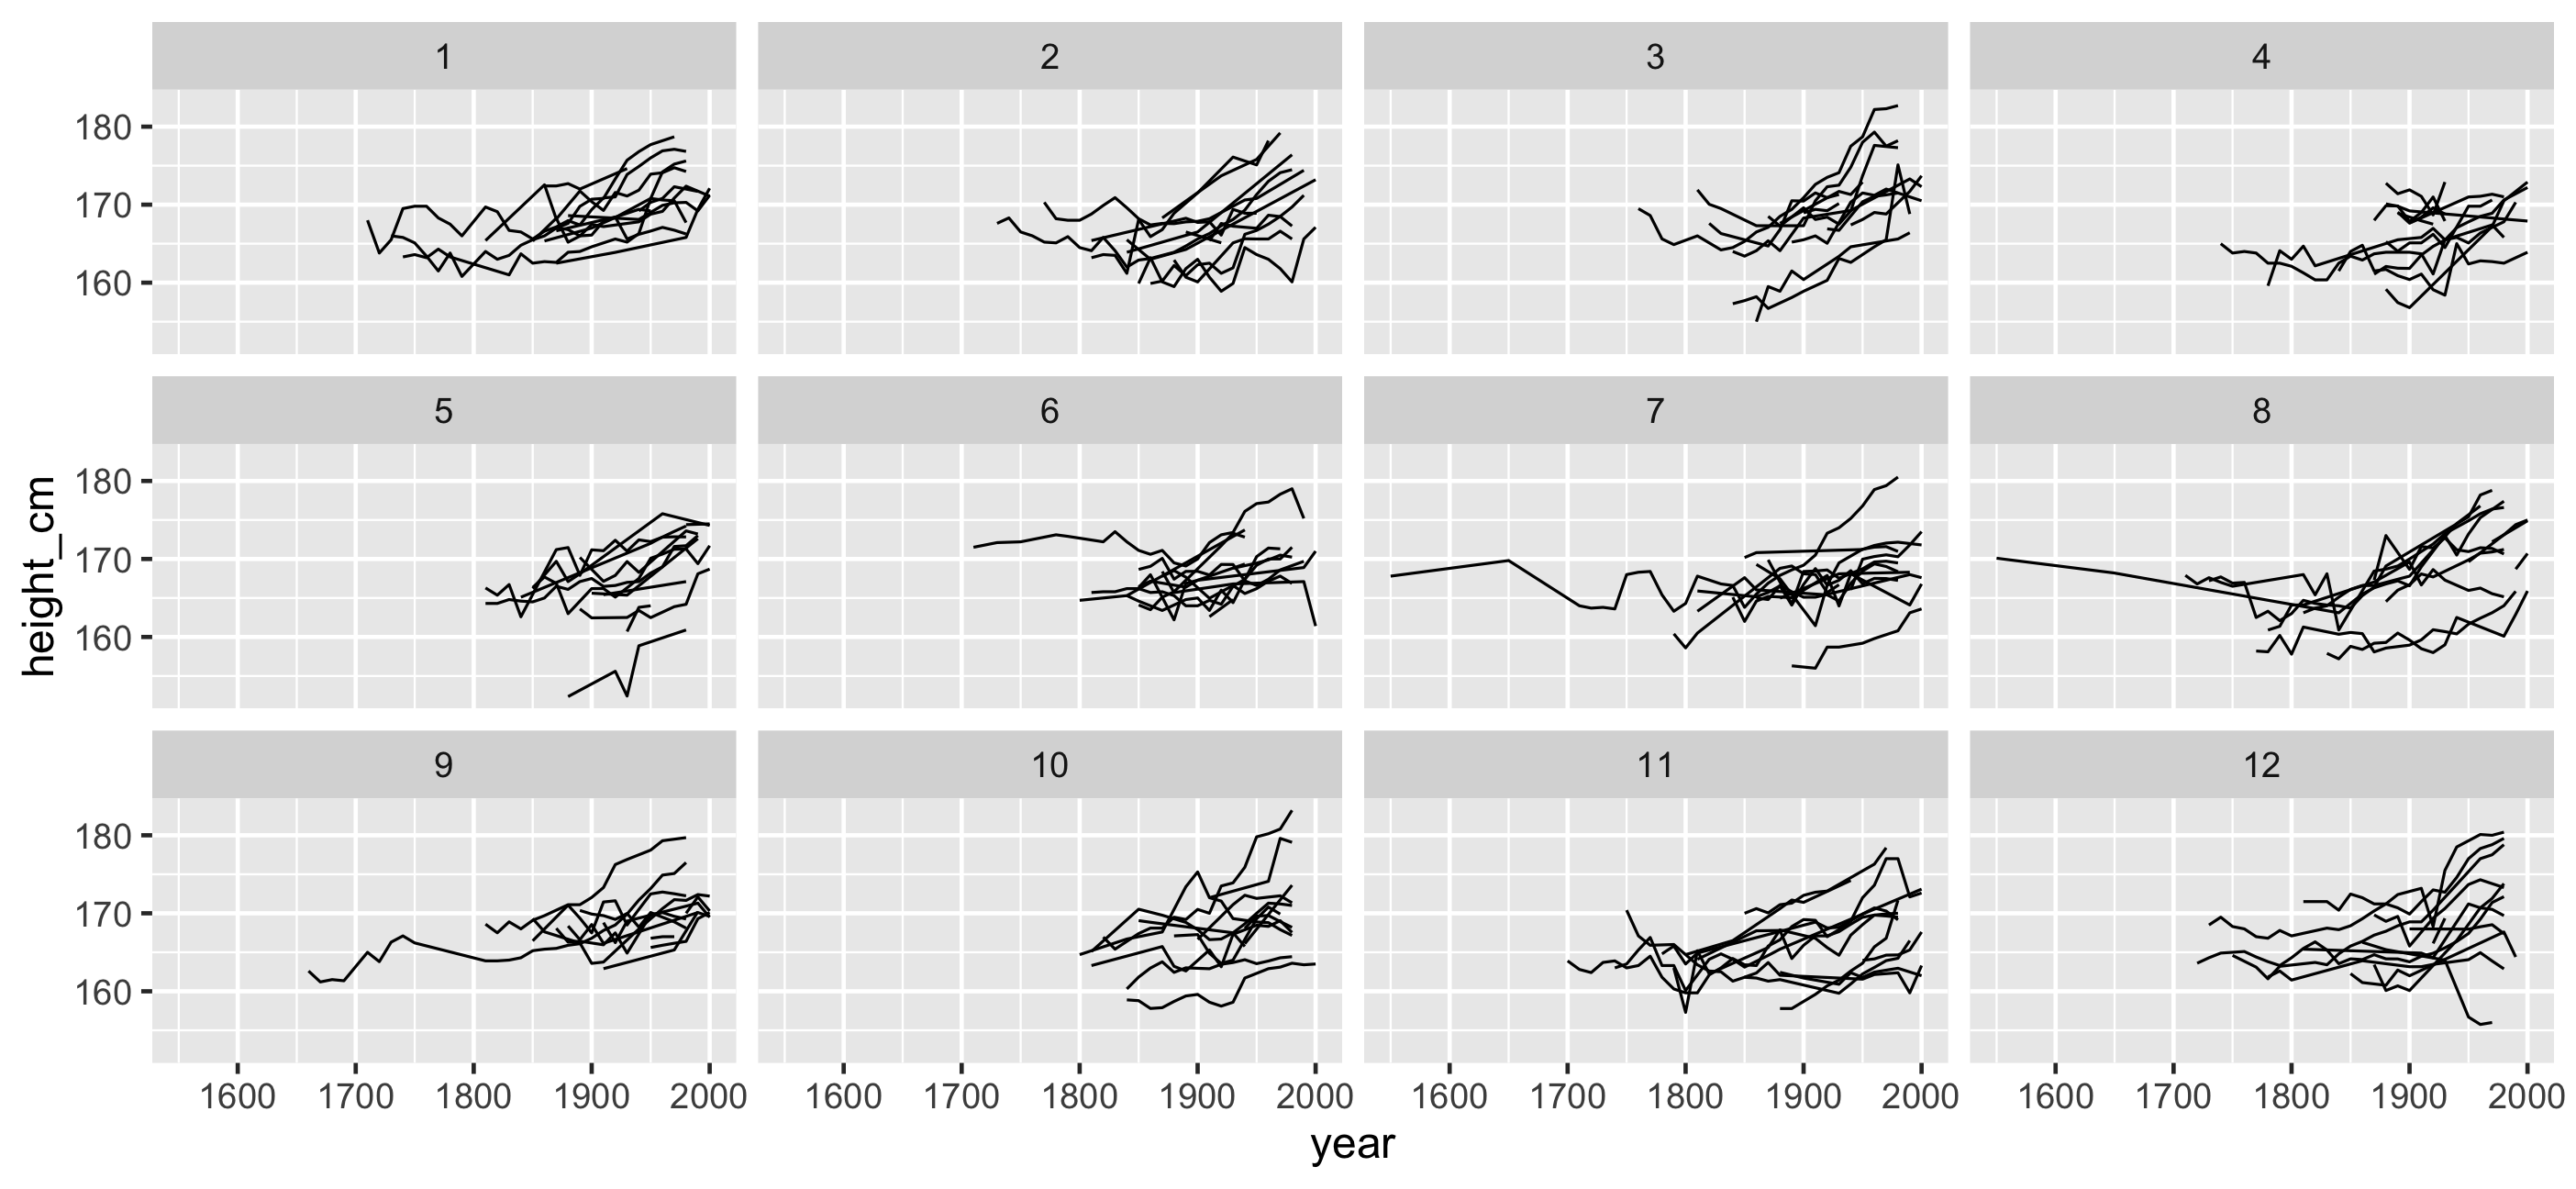
🤔 ... can we re-order these facets?
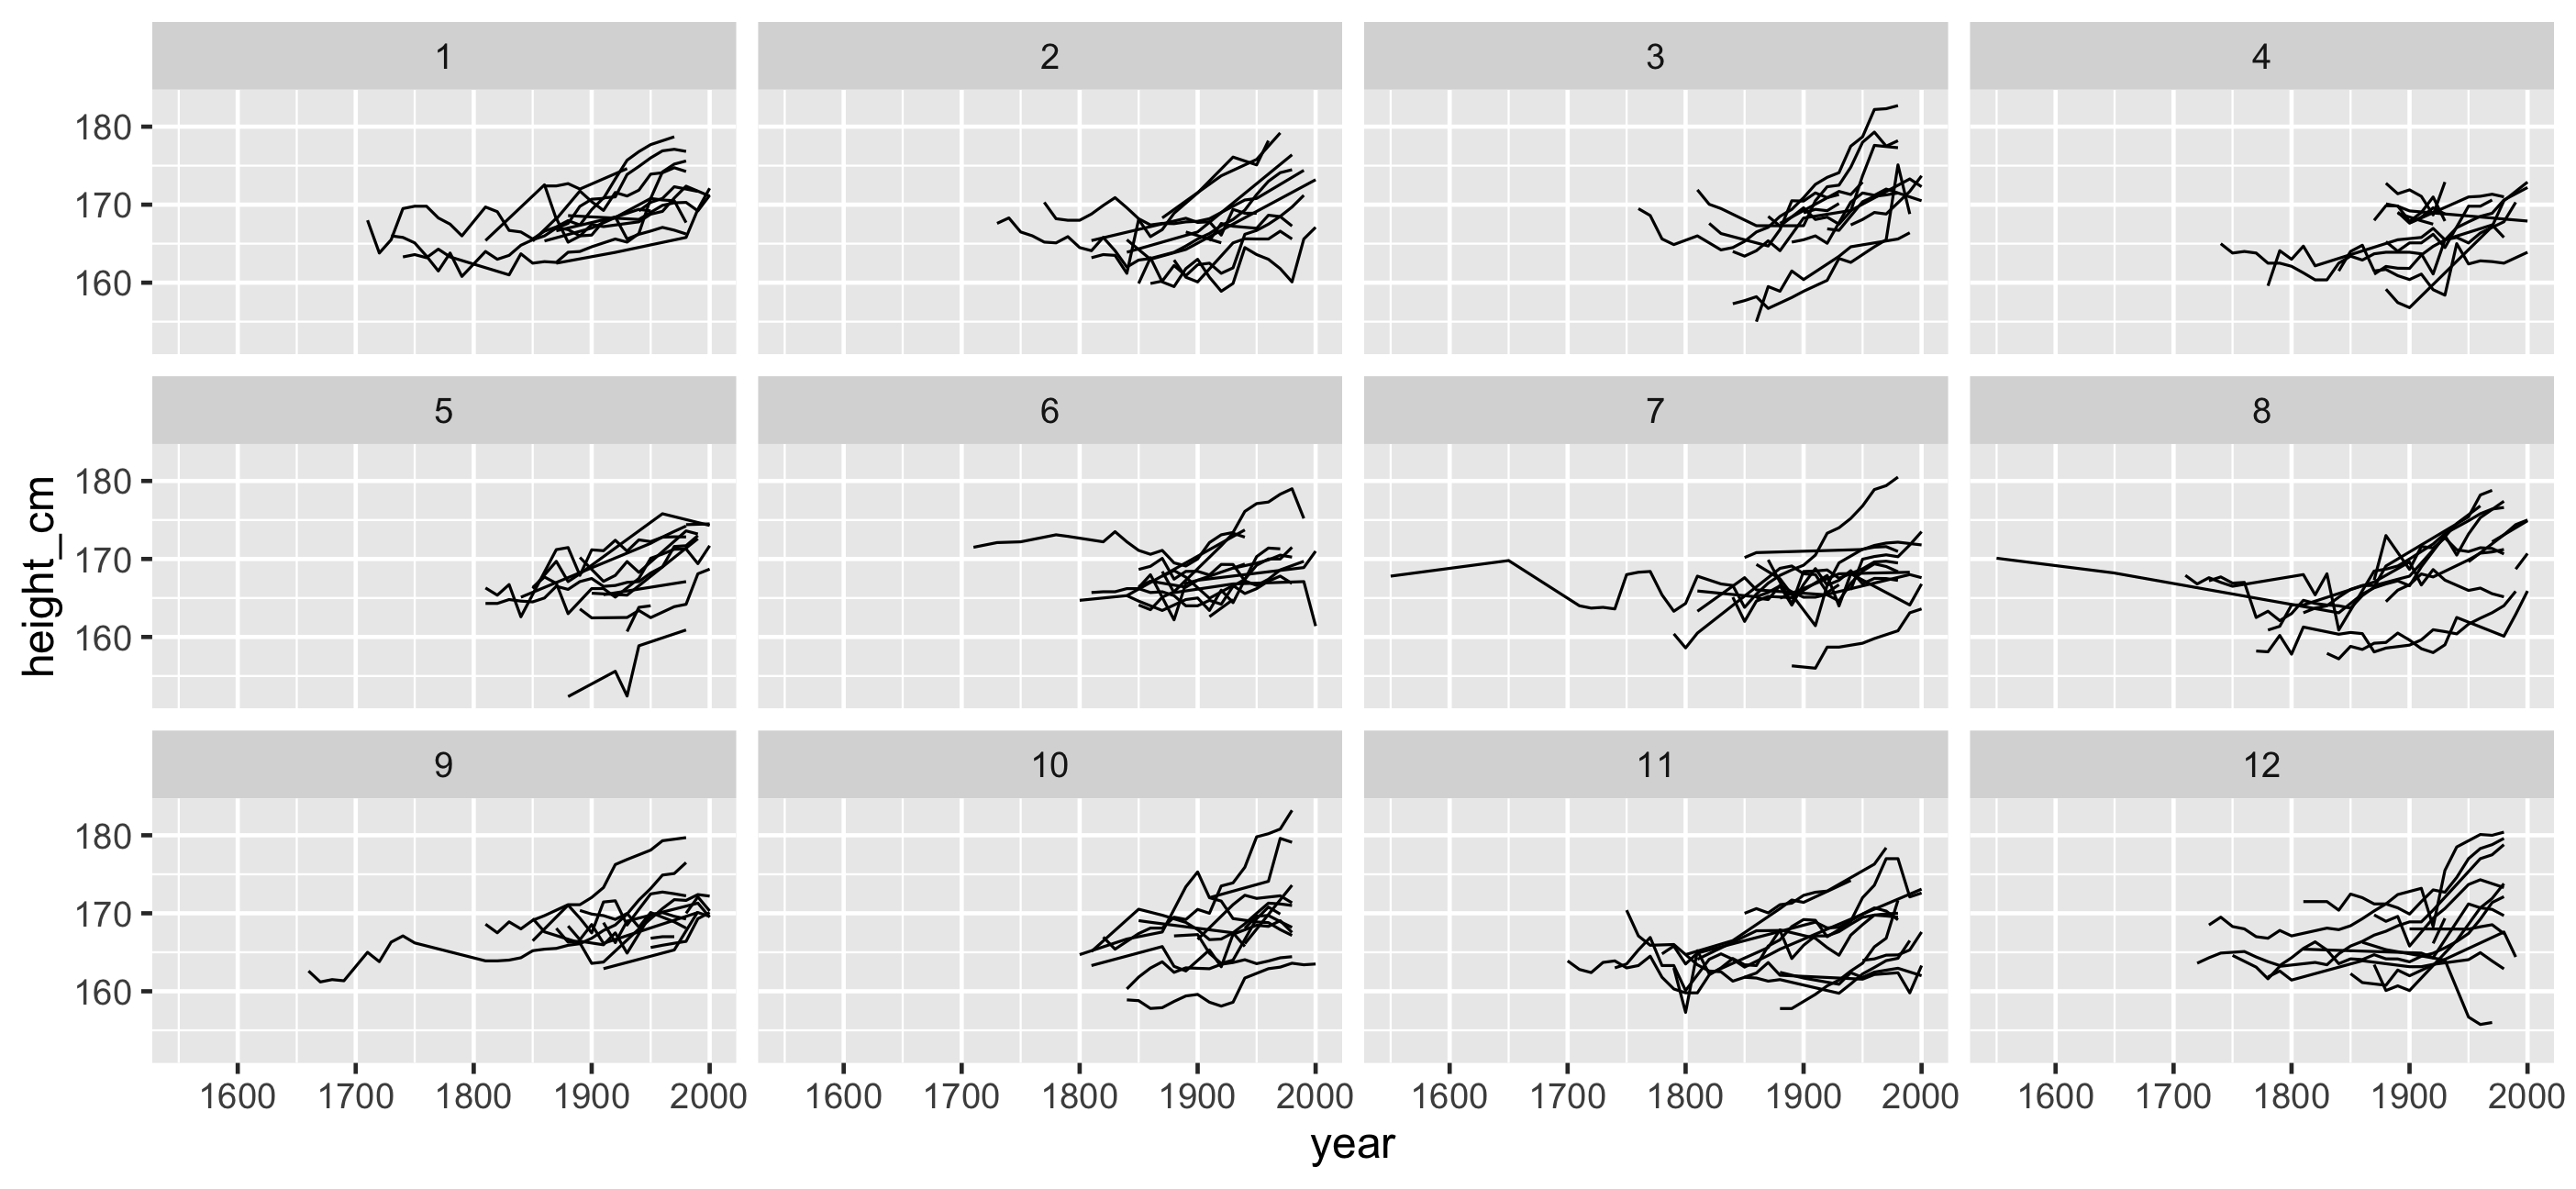
In asking these questions we can solve something else interesting
We can re-order these facets?! 😄
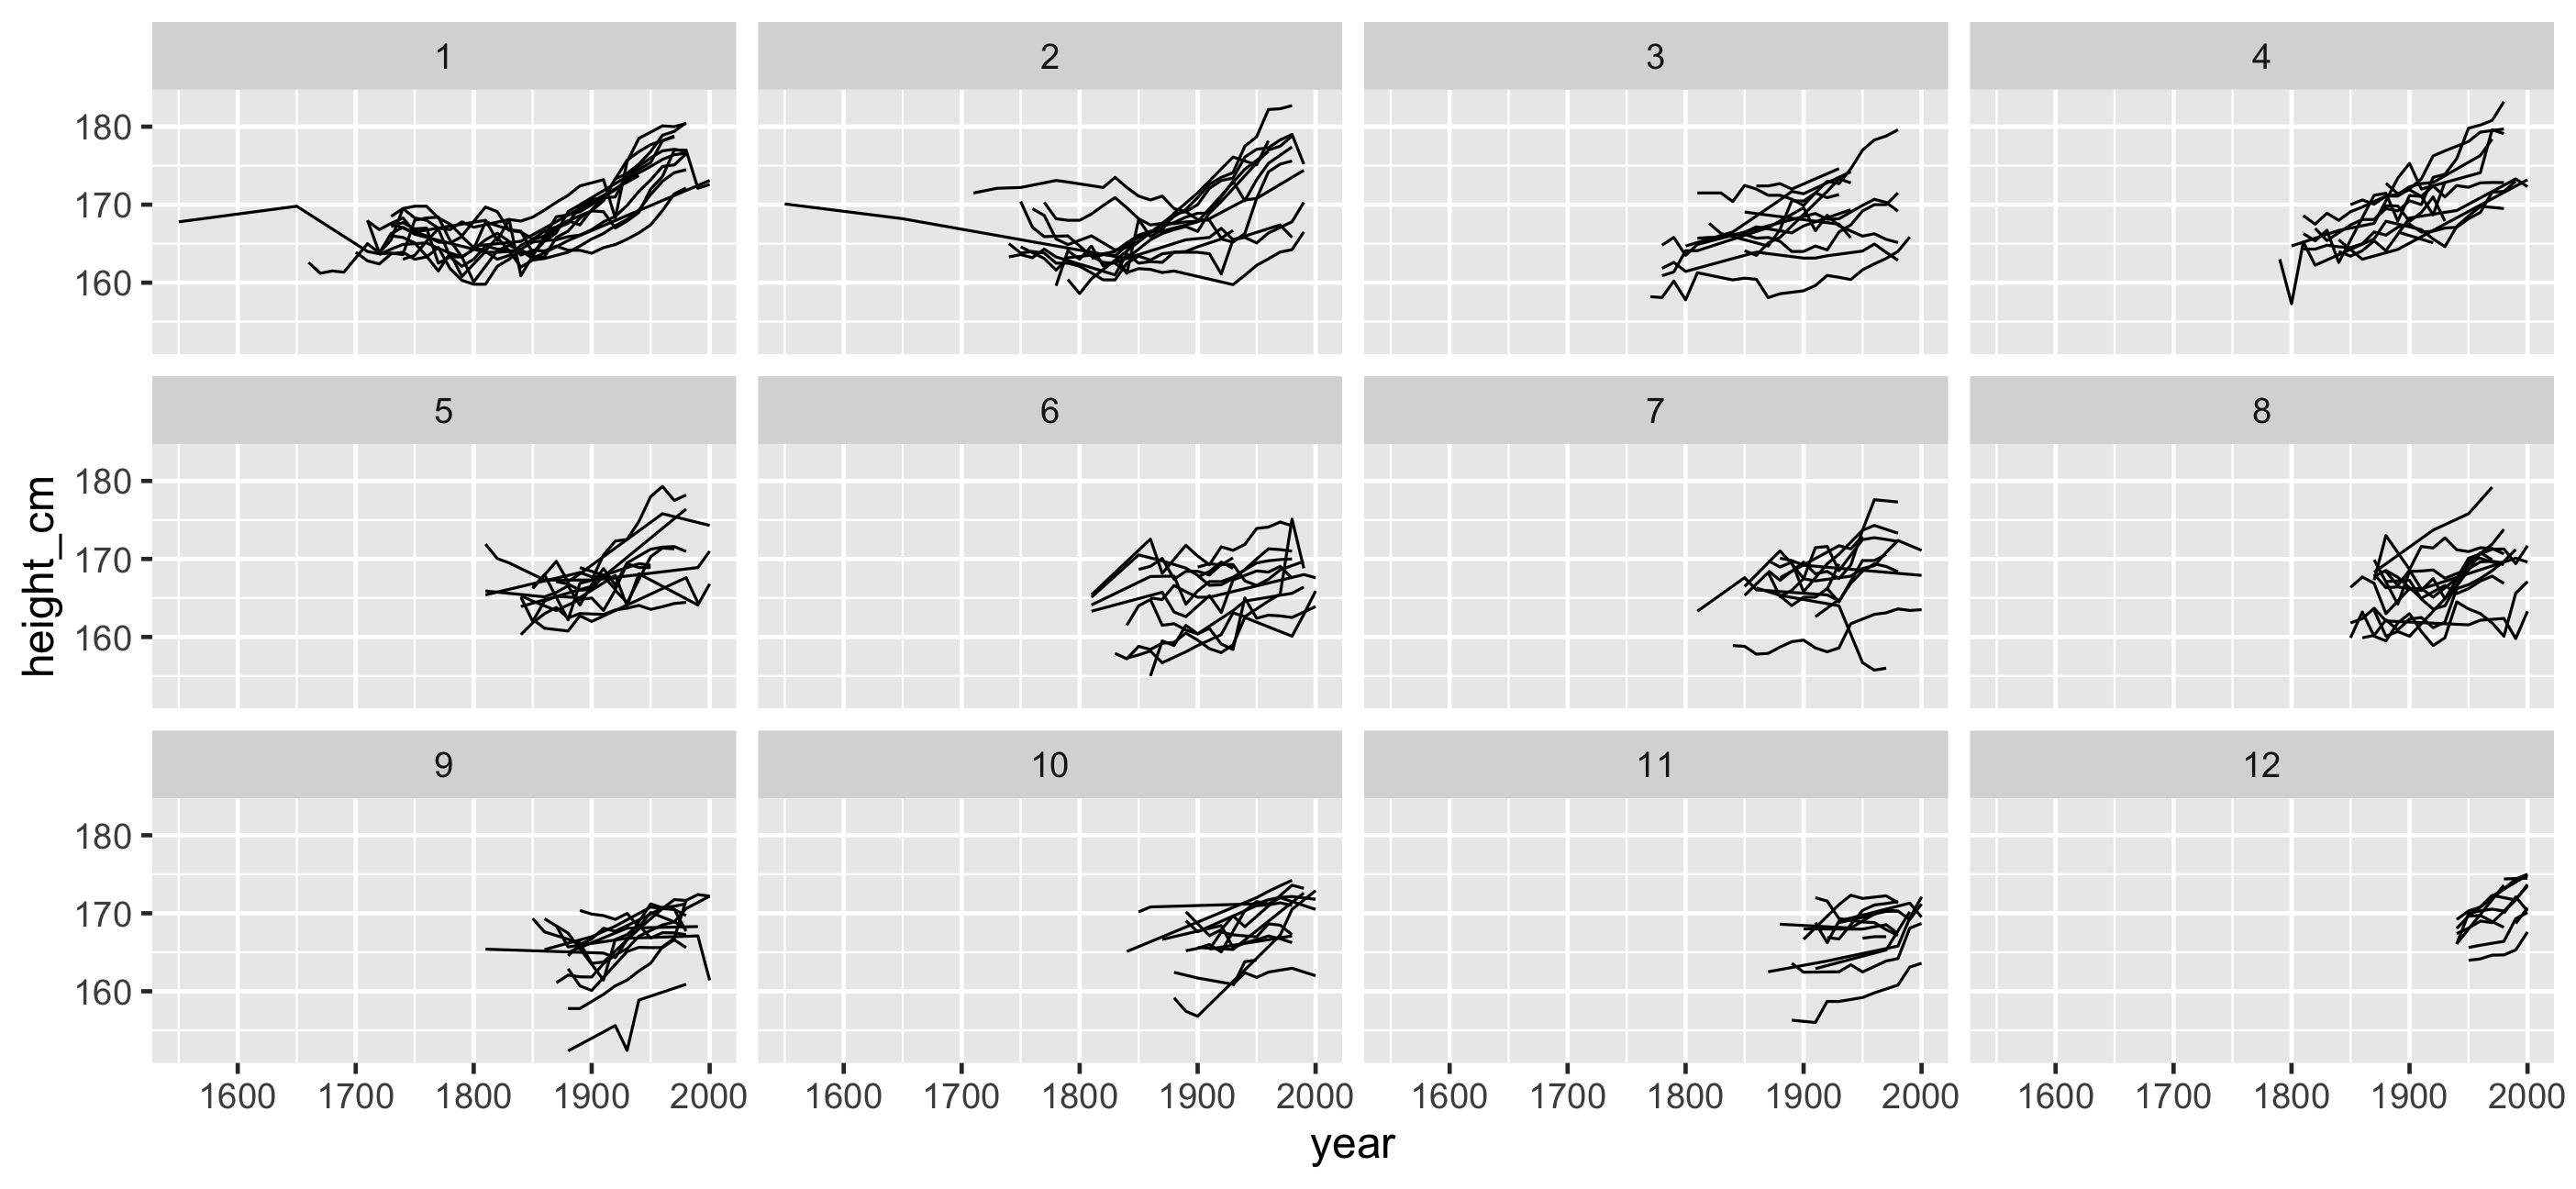
See all individuals along some variable
gg_heights + facet_strata( along = -year )See all individuals along some variable
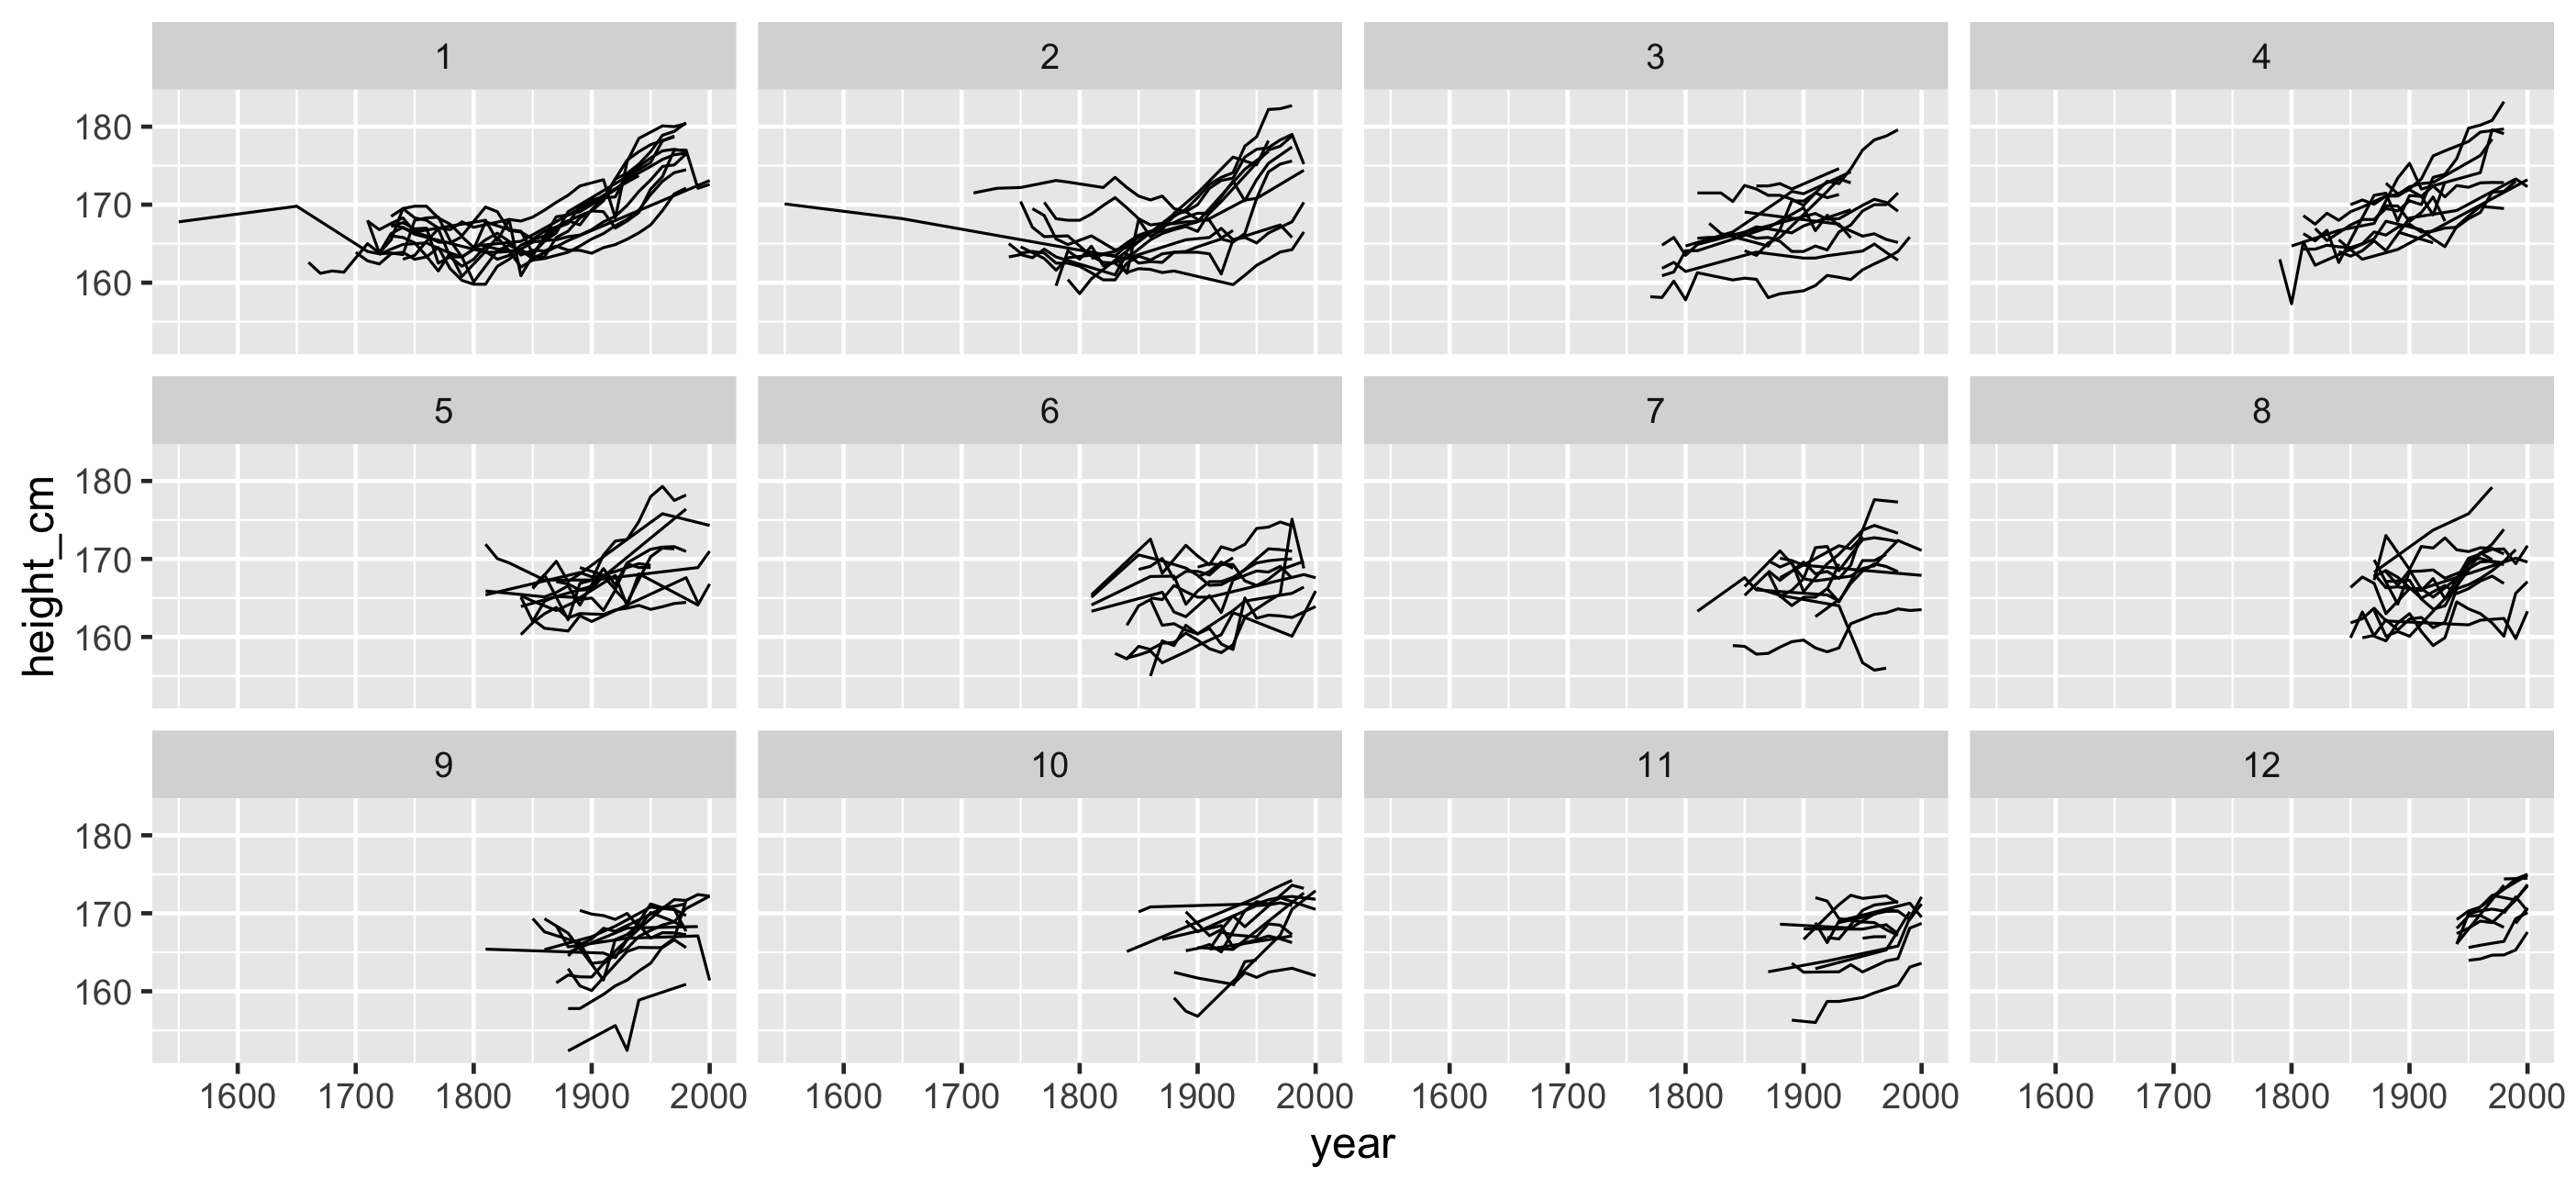
Magic facets: Focus on relevant questions instead of minutiae:
Magic facets: Focus on relevant questions instead of minutiae:
facet_sample()
"How many lines per facet"
"How many facets?"
gg_heights + facet_sample( n_per_facet = 10, n_facets = 12 )Magic facets: Focus on relevant questions instead of minutiae:
facet_sample()
"How many lines per facet"
"How many facets?"
gg_heights + facet_sample( n_per_facet = 10, n_facets = 12 )facet_strata()
"How many facets / strata?"
"What to arrange plots along?"
gg_heights + facet_strata( n_strata = 10, along = -year )facet_strata() & facet_sample()

with sample_n_keys() & stratify_keys()
You can still get at data and do manipulations
Problem #1: How do I look at some of the data?
Problem #1: How do I look at some of the data?
as_tsibble()
facet_sample()
facet_strata()
Problem #1: How do I look at some of the data?
as_tsibble()
facet_sample()
facet_strata()
Store useful information
View many subsamples
View all subsamples
Problem #1: How do I look at some of the data?
as_tsibble()
facet_sample()
facet_strata()
Store useful information
View many subsamples
View all subsamples
Problem #2: How do I find interesting observations?
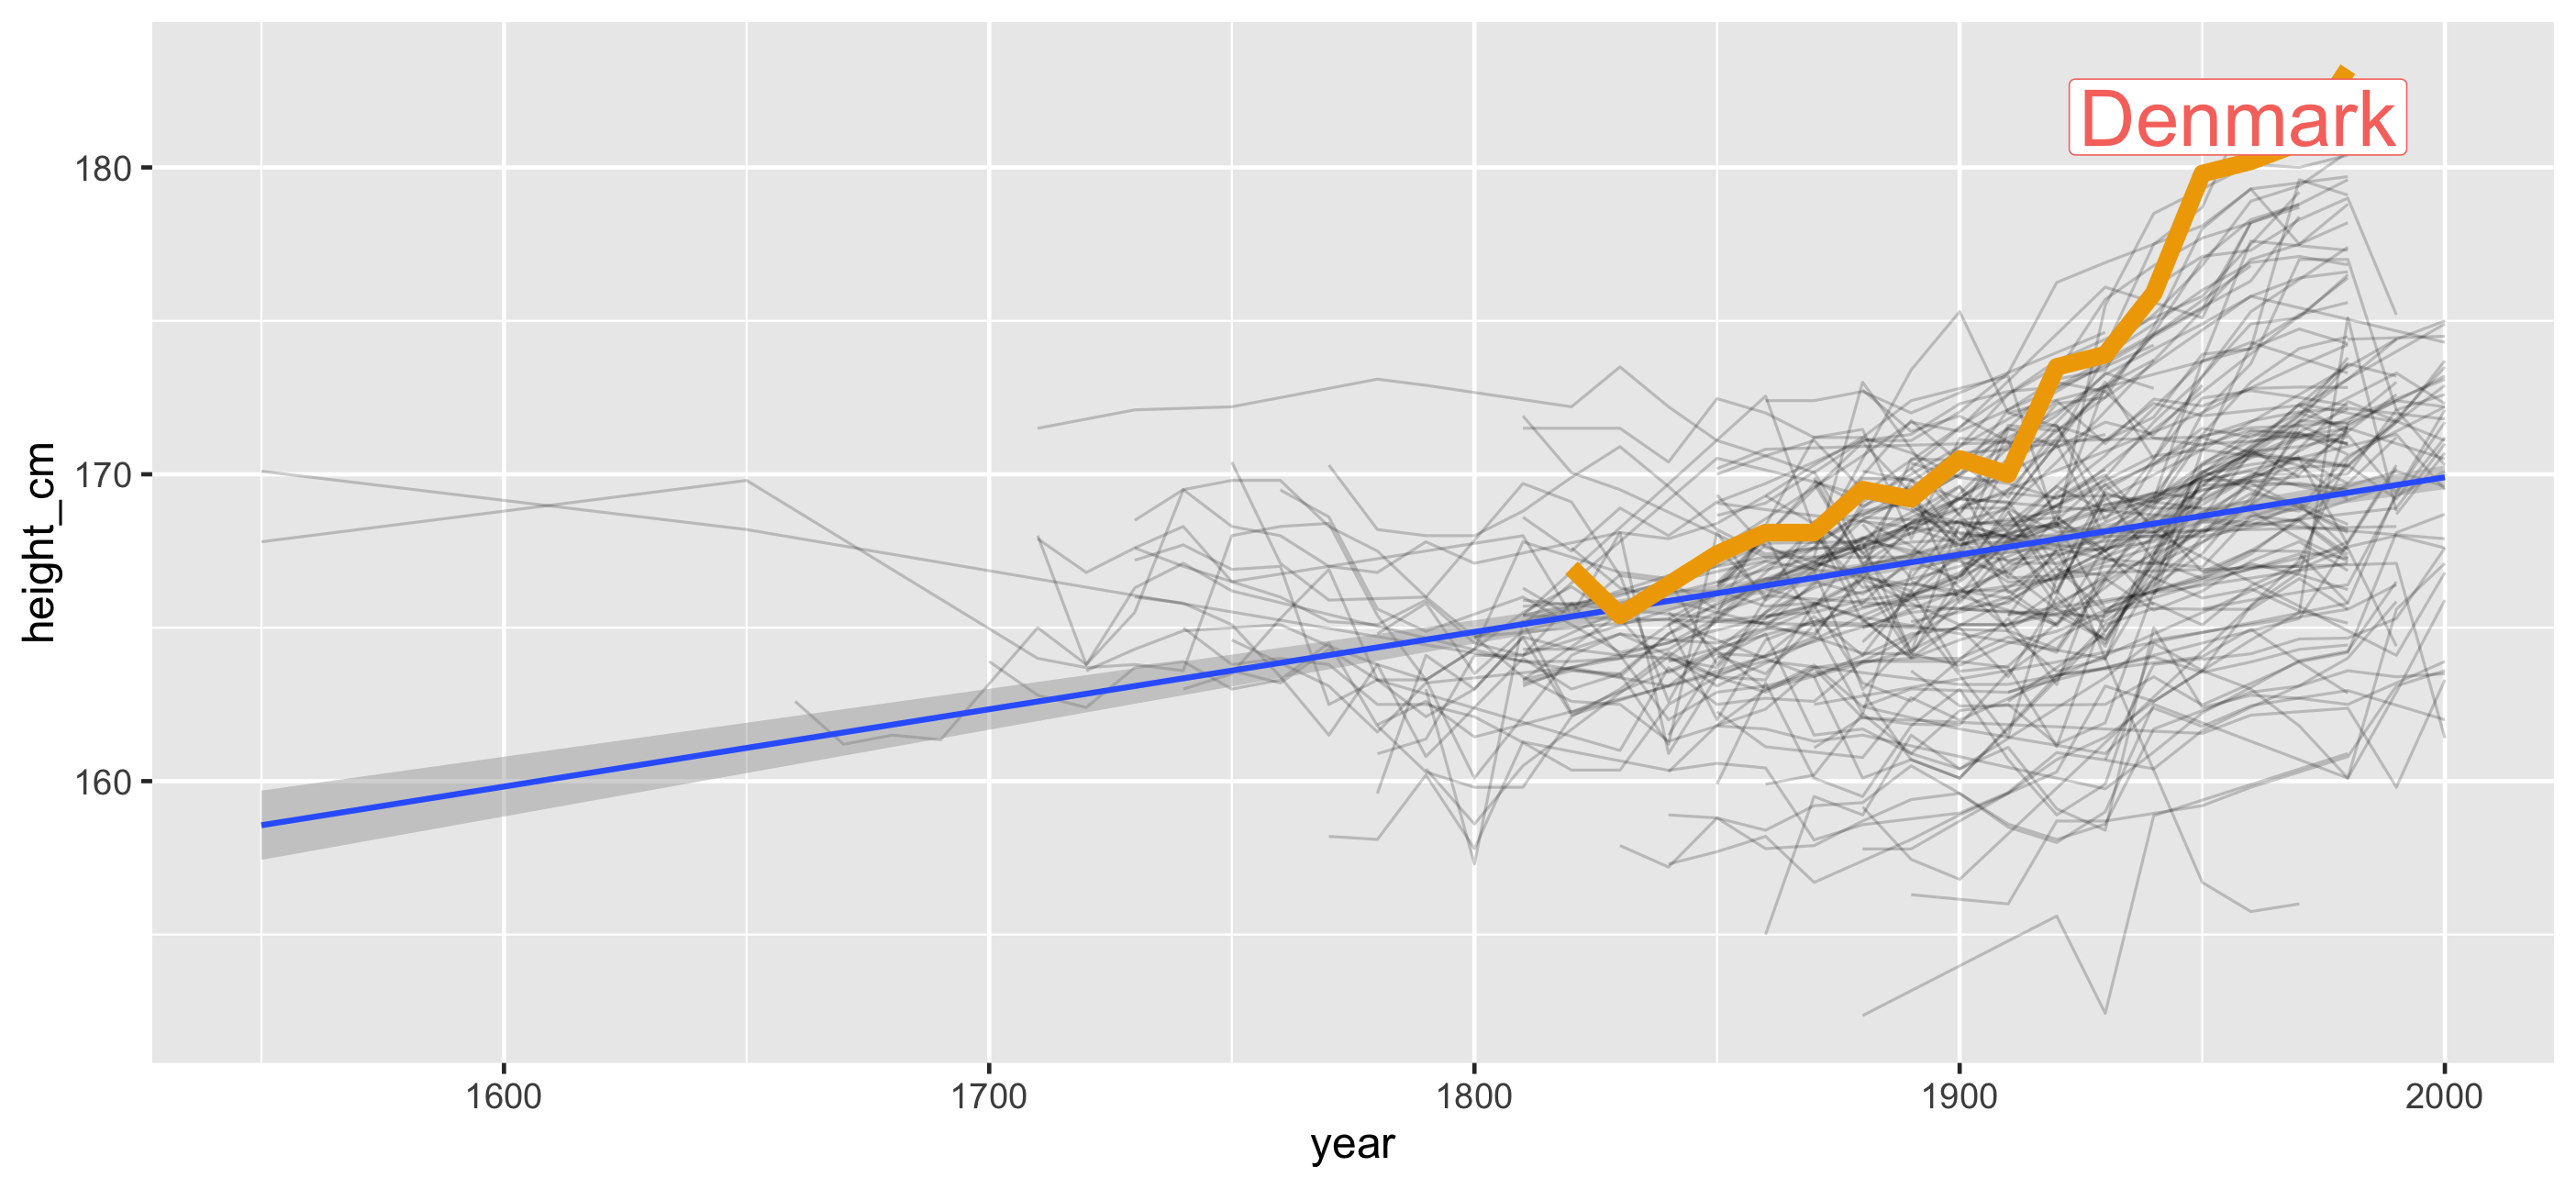
A workflow
A workflow
Define what is interesting:
A workflow
Define what is interesting:
maximum height
Identify features: one observation per key
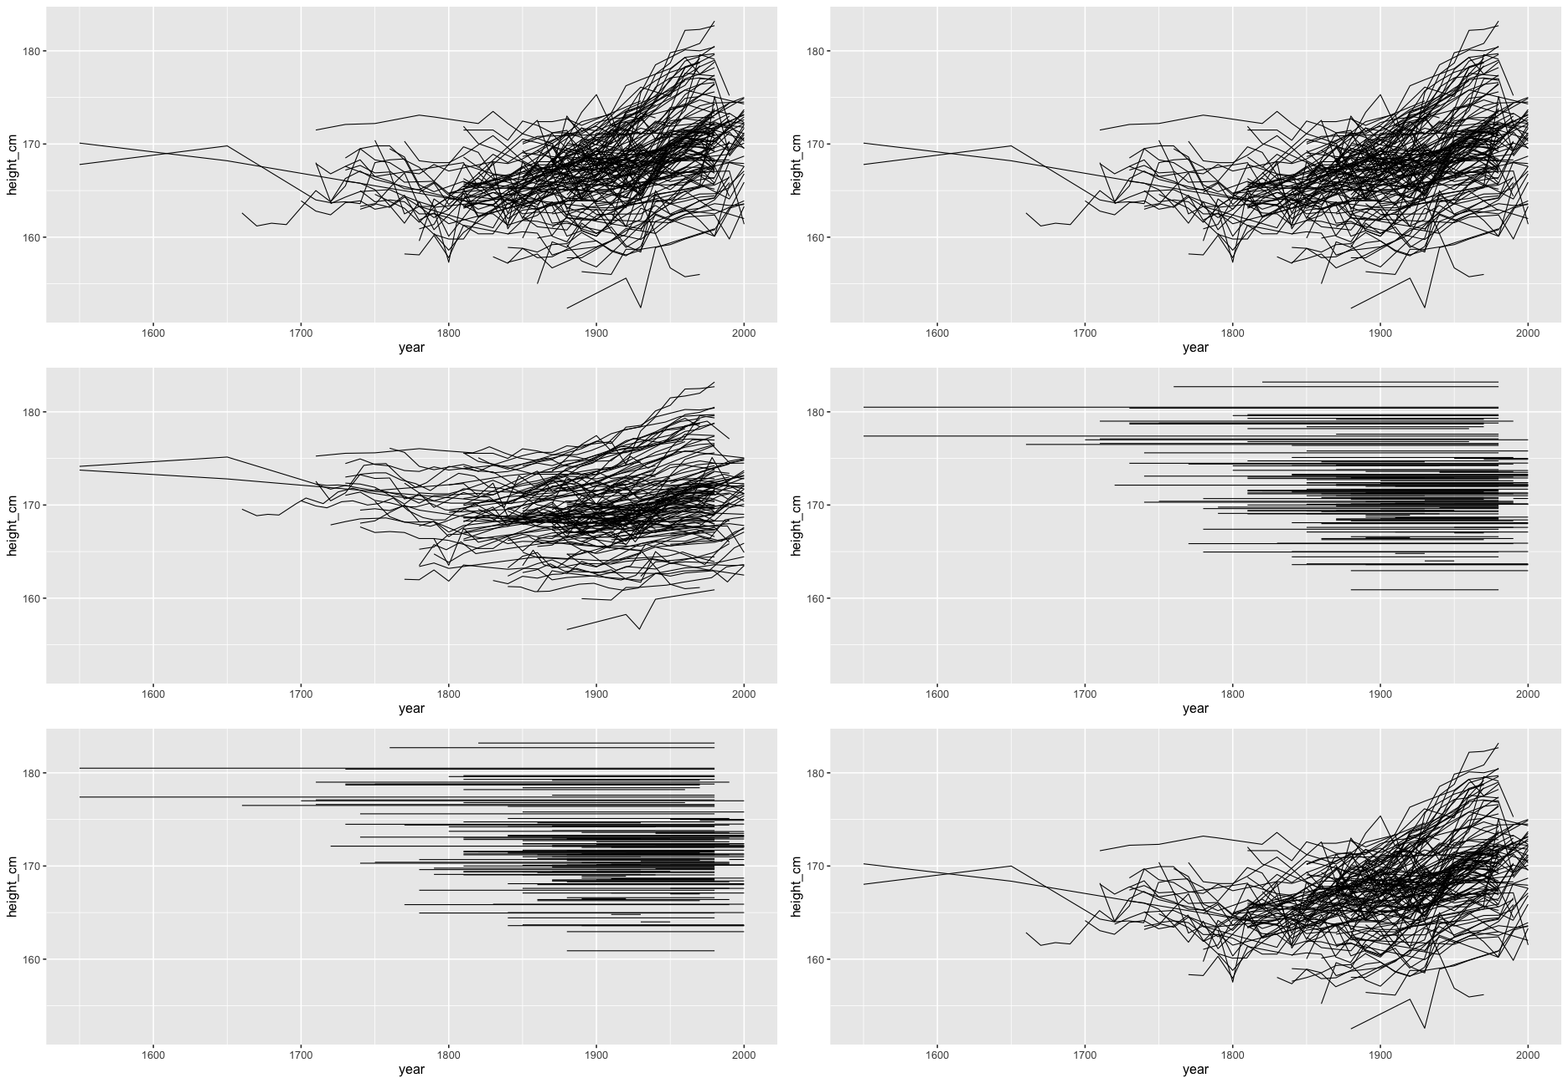
Identify features: one observation per key
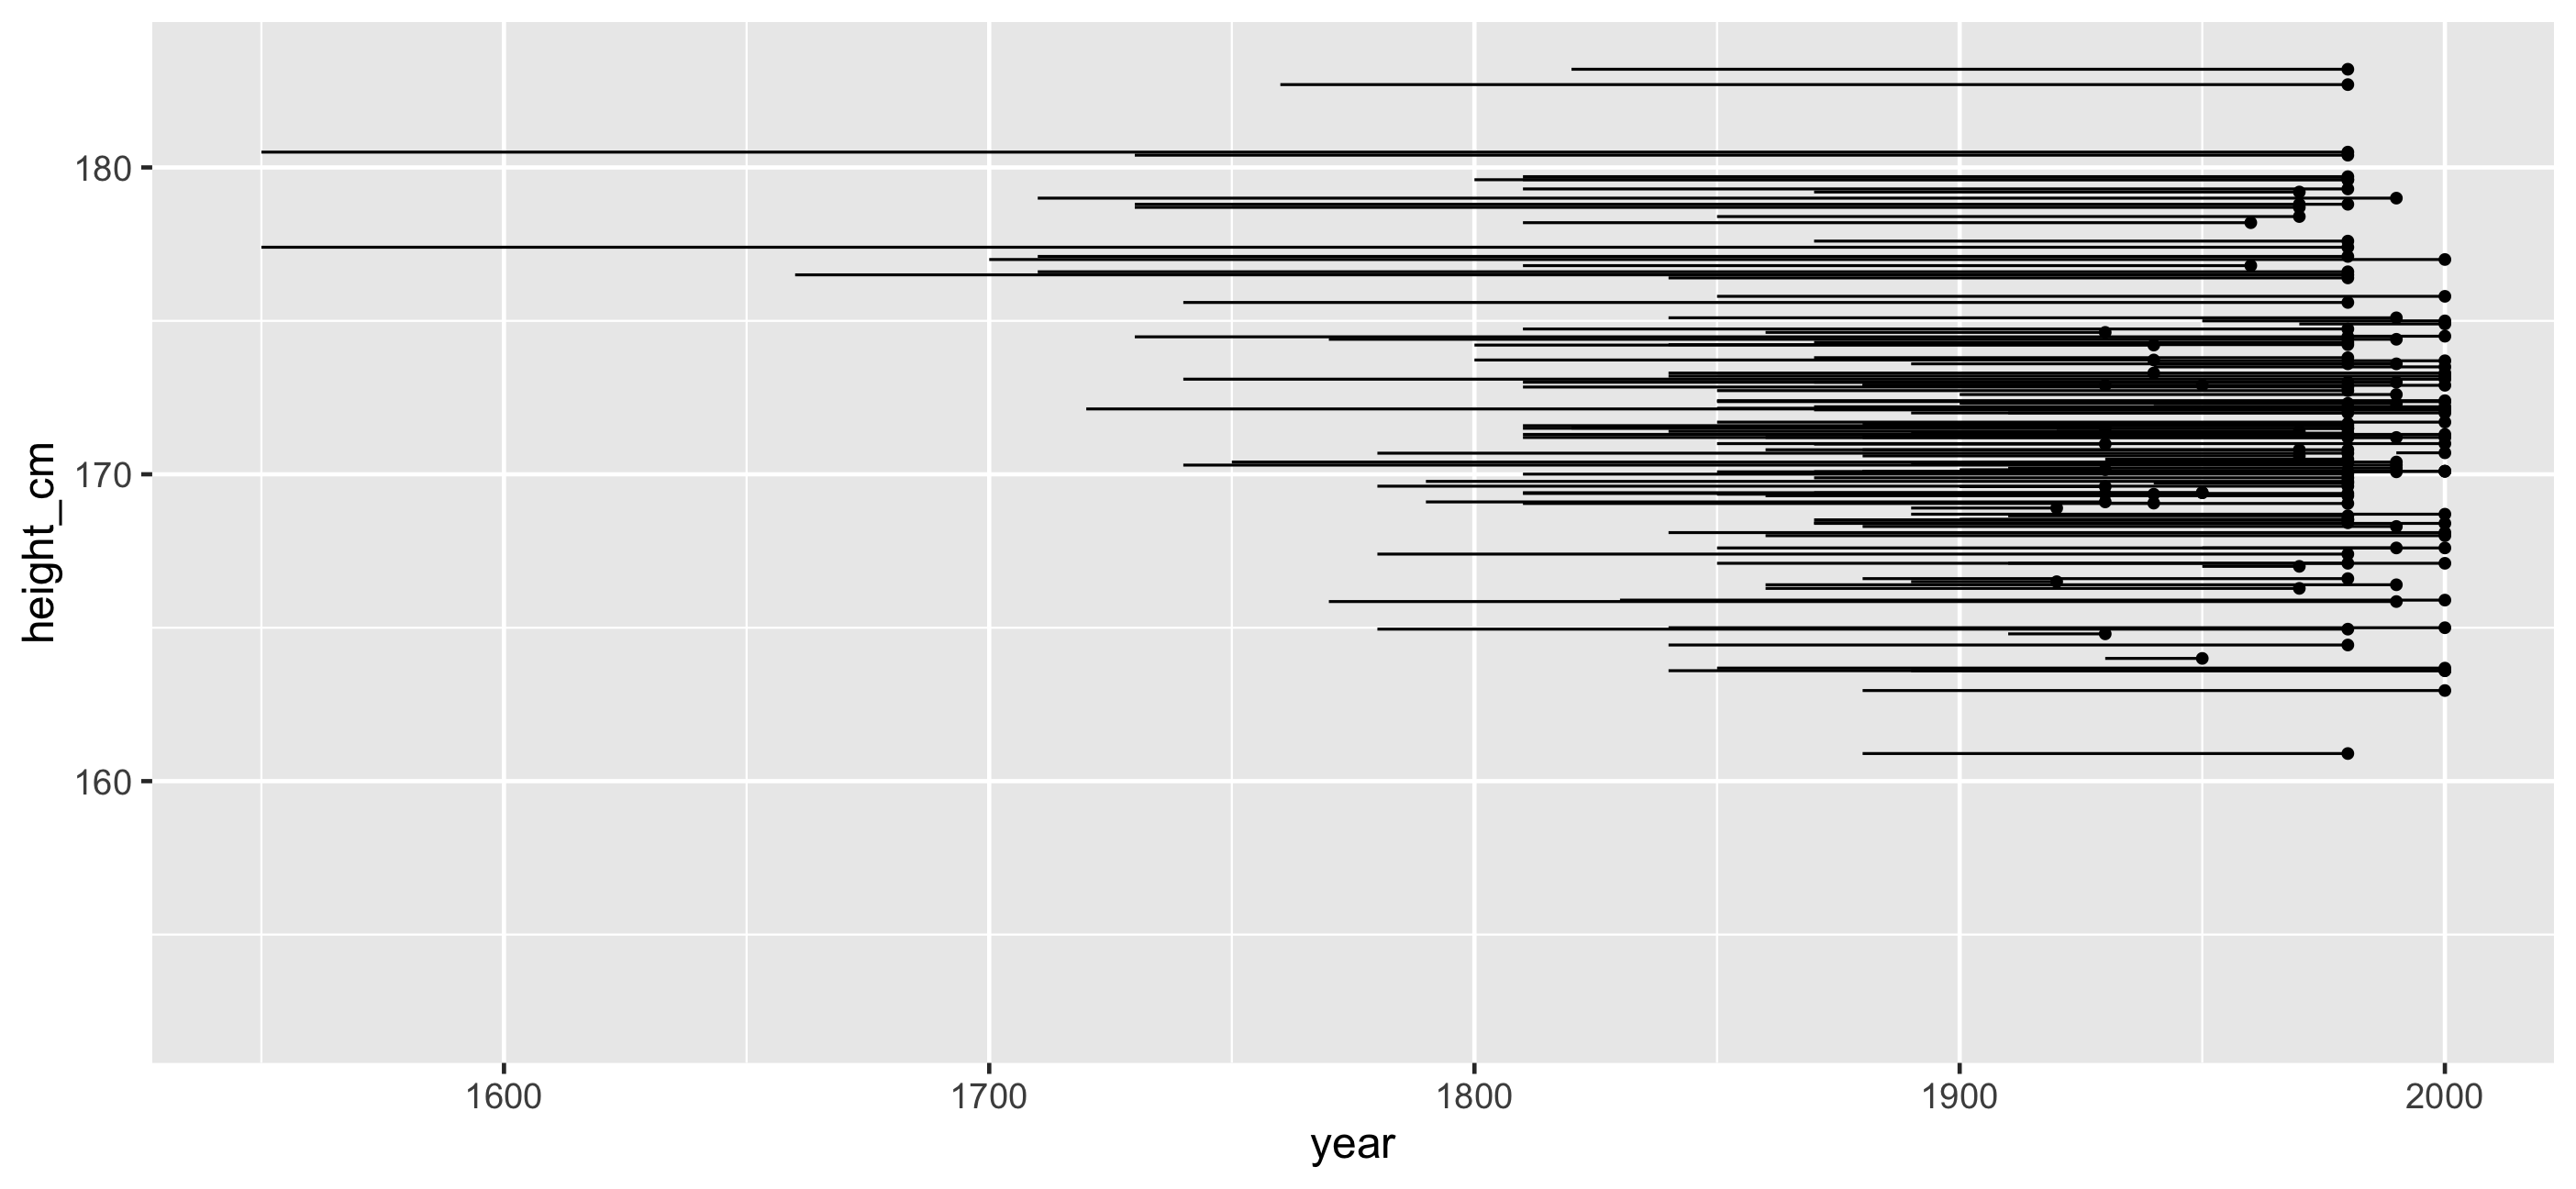
Identify features: one observation per key
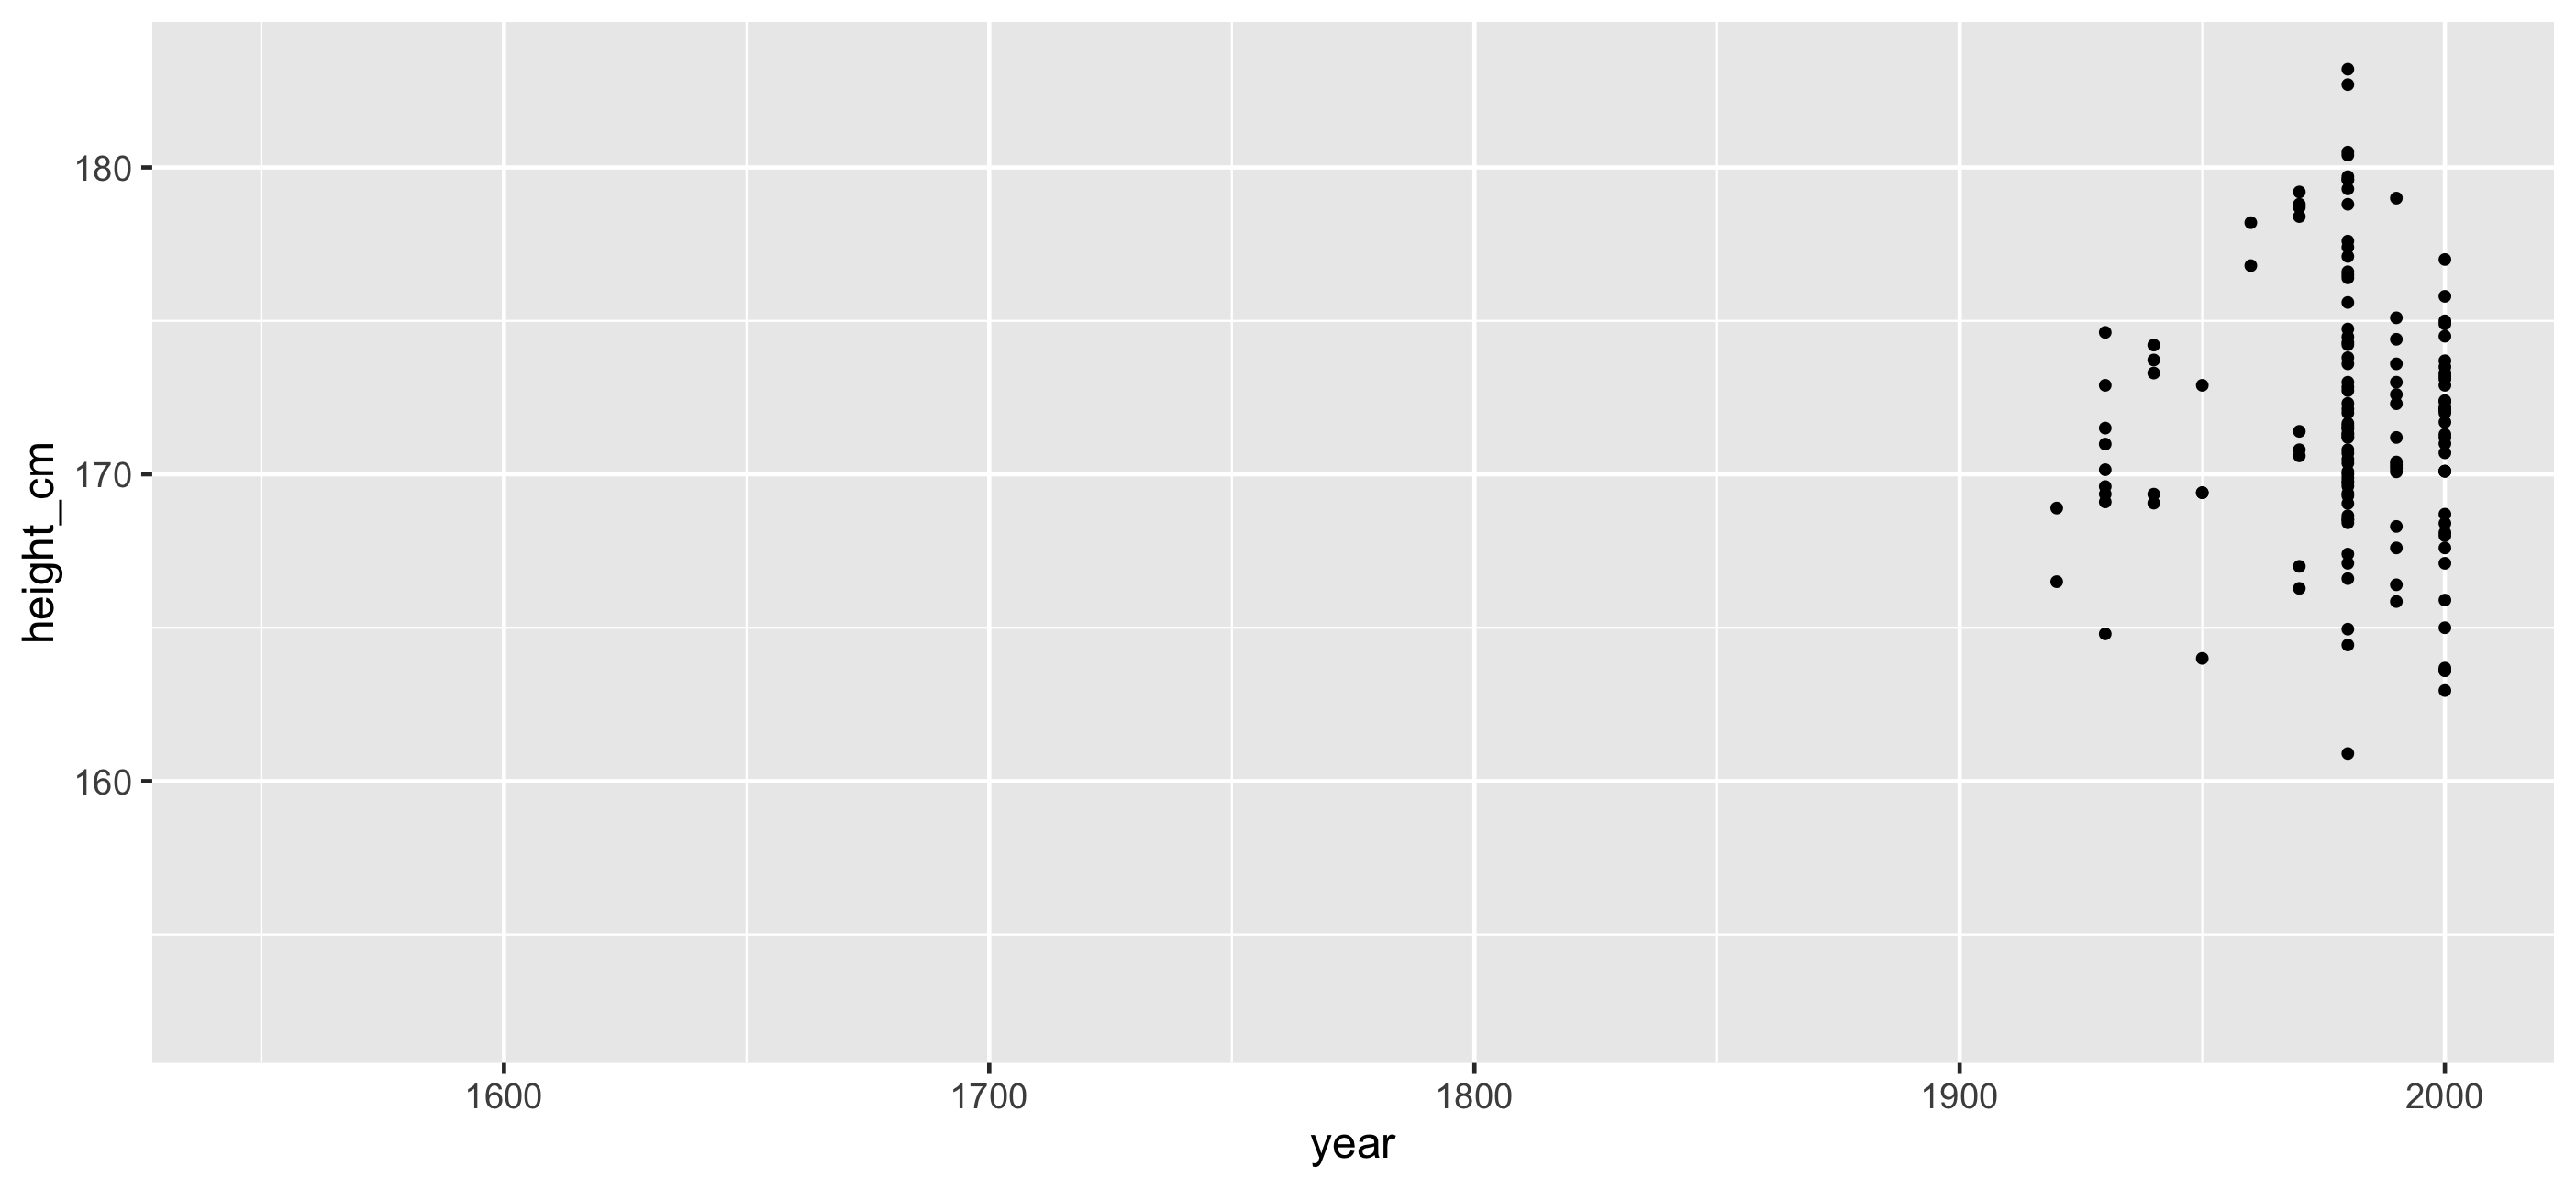
Identify important features and decide how to filter
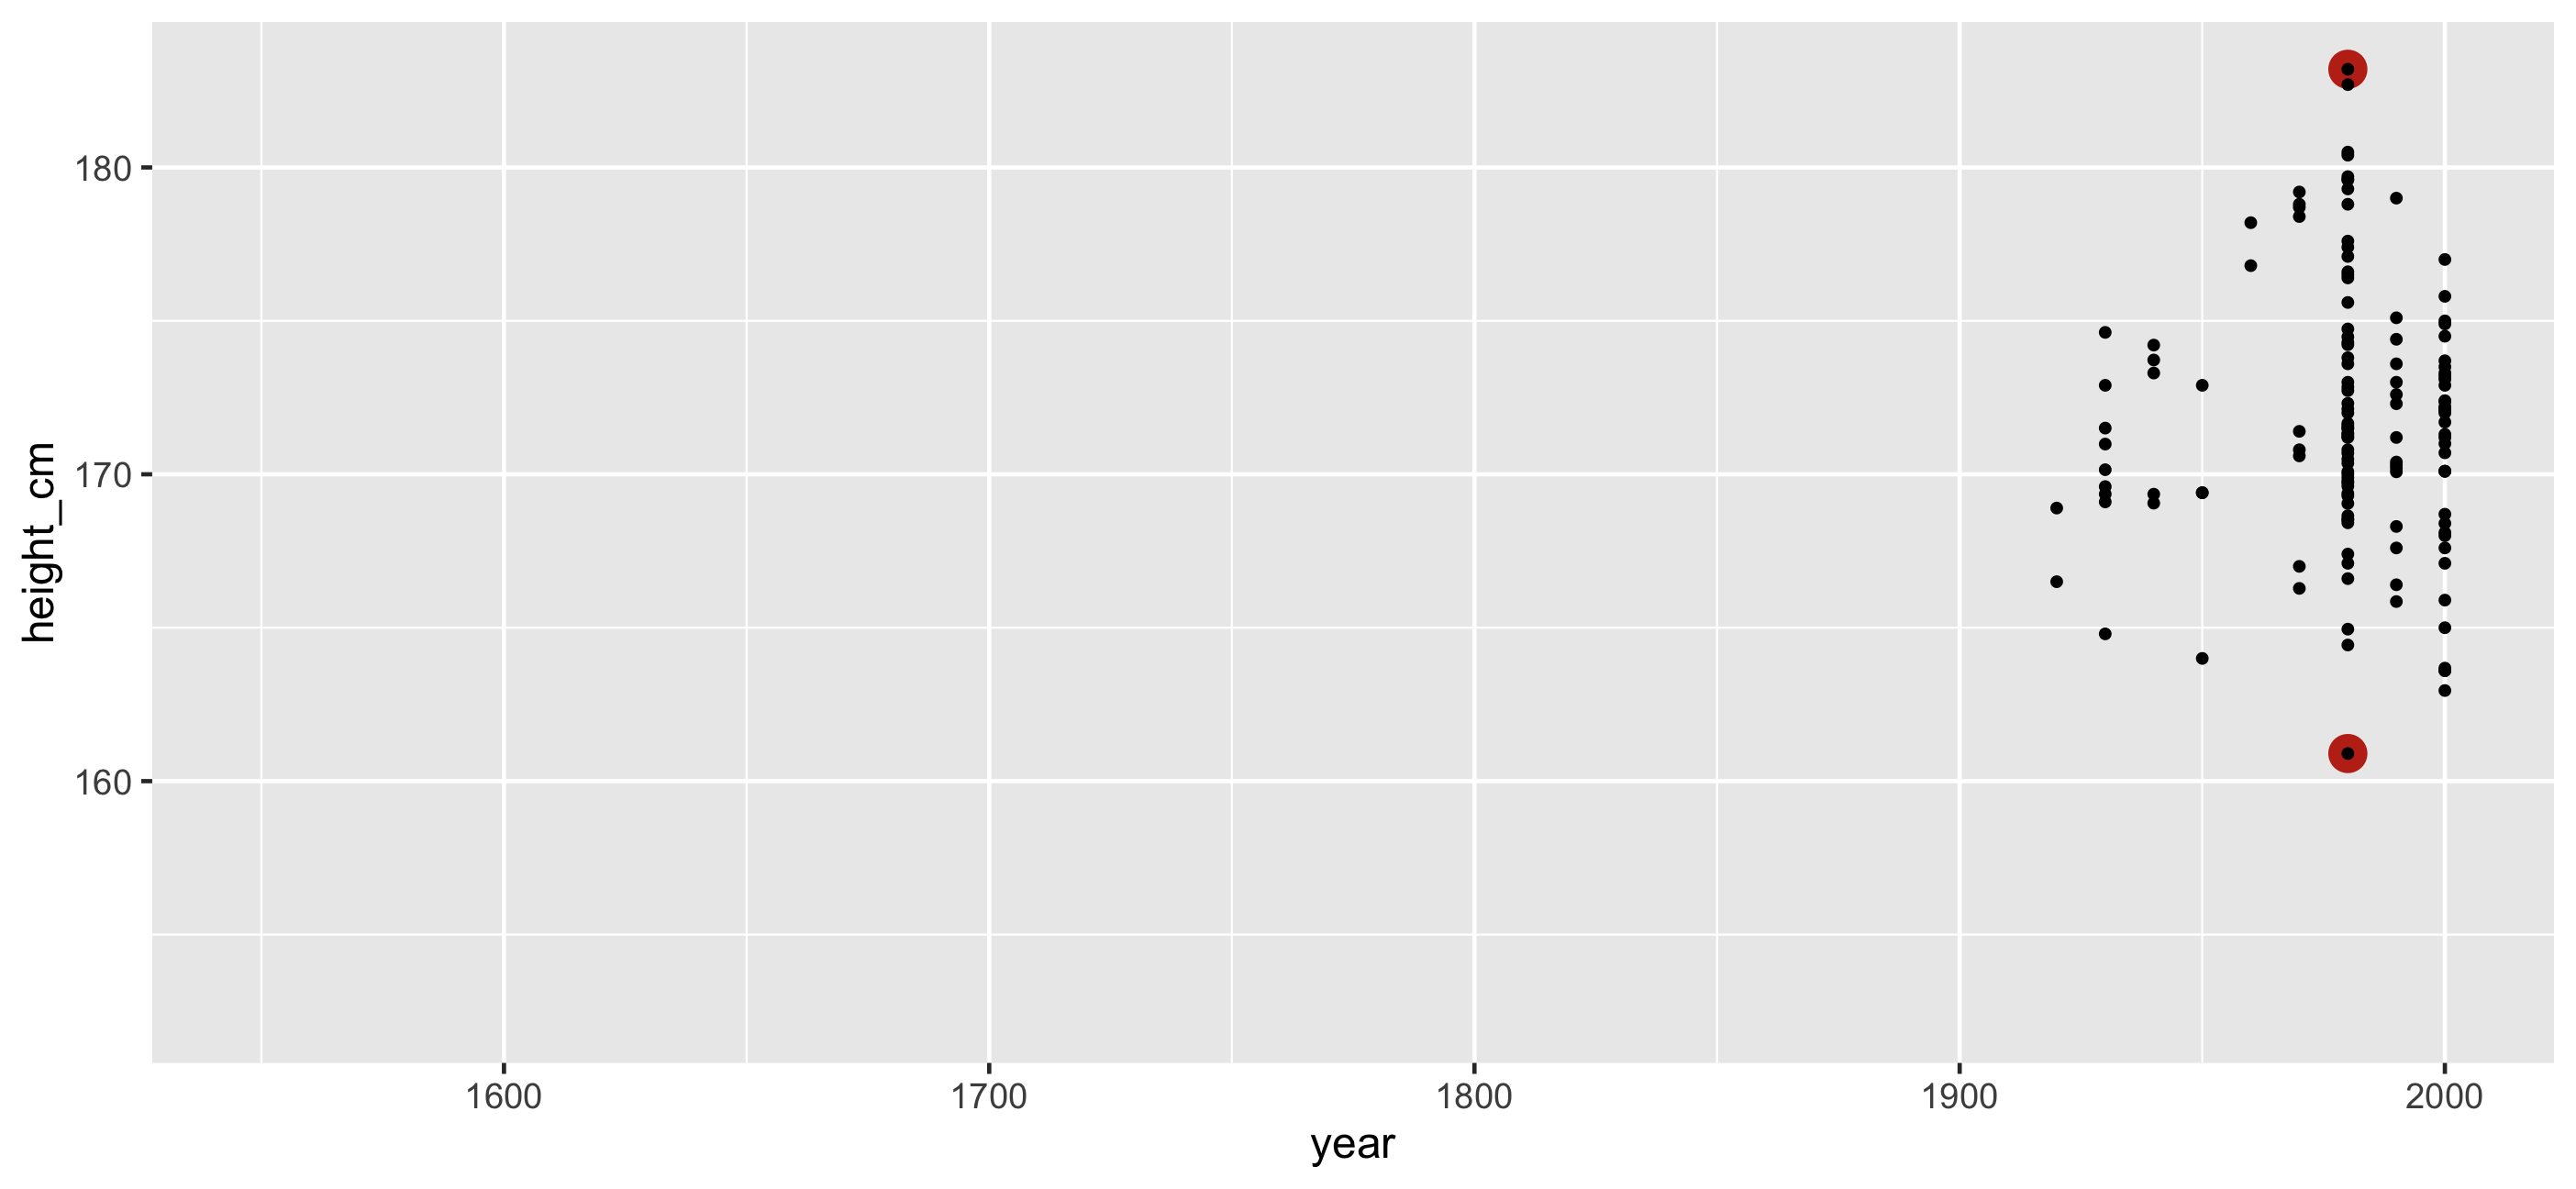
Identify important features and decide how to filter
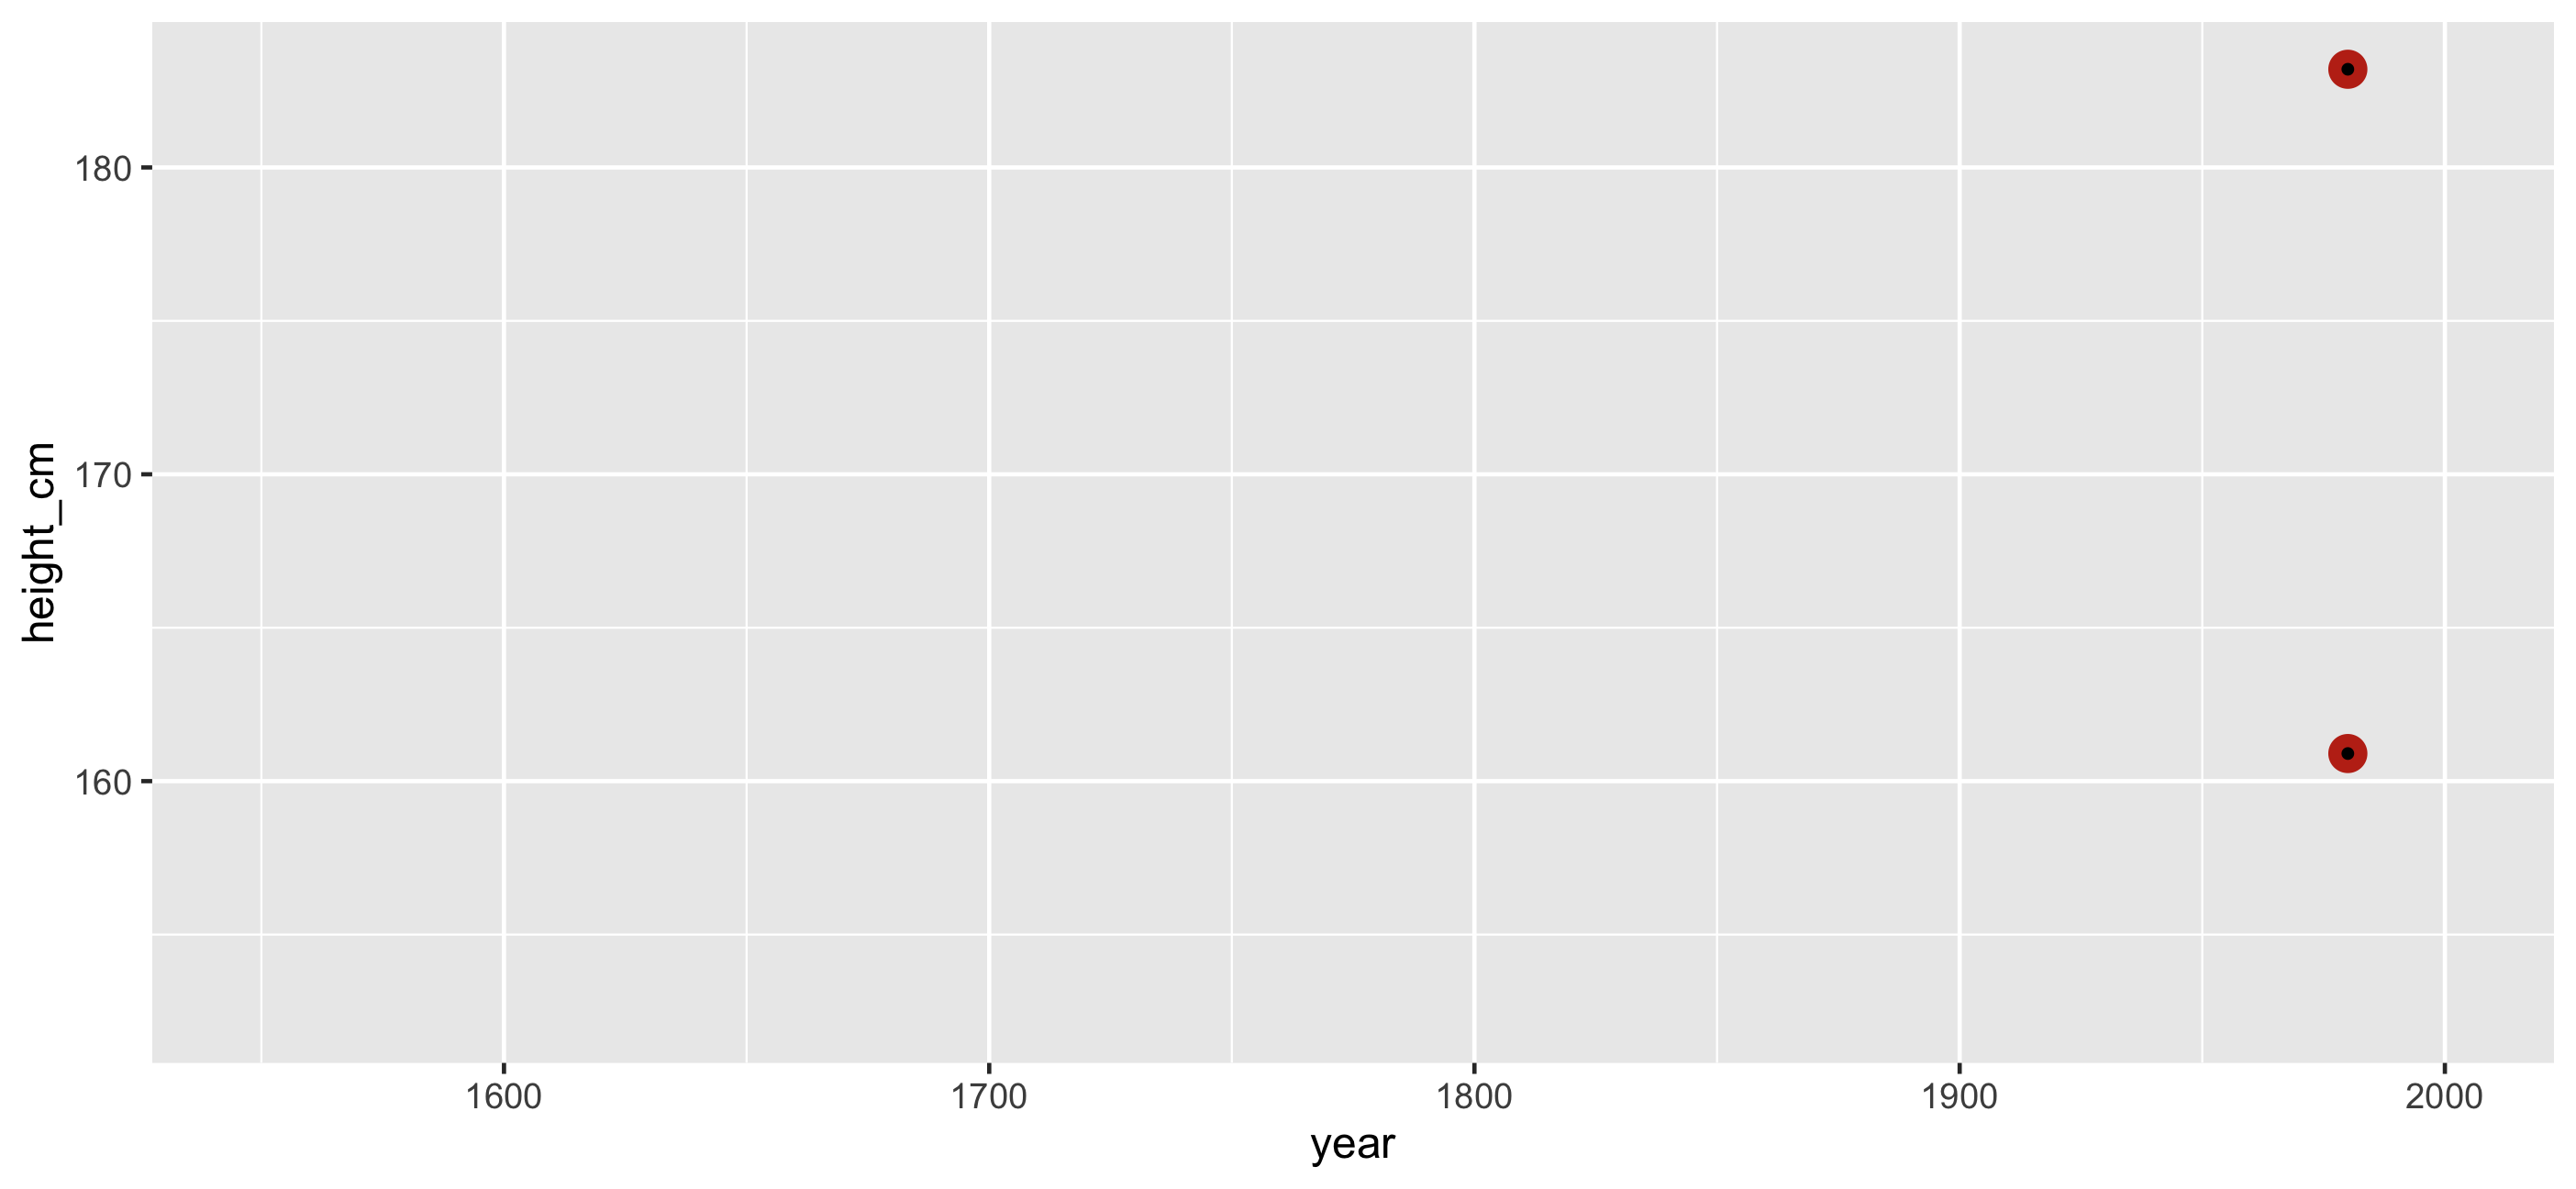
Join this feature back to the data
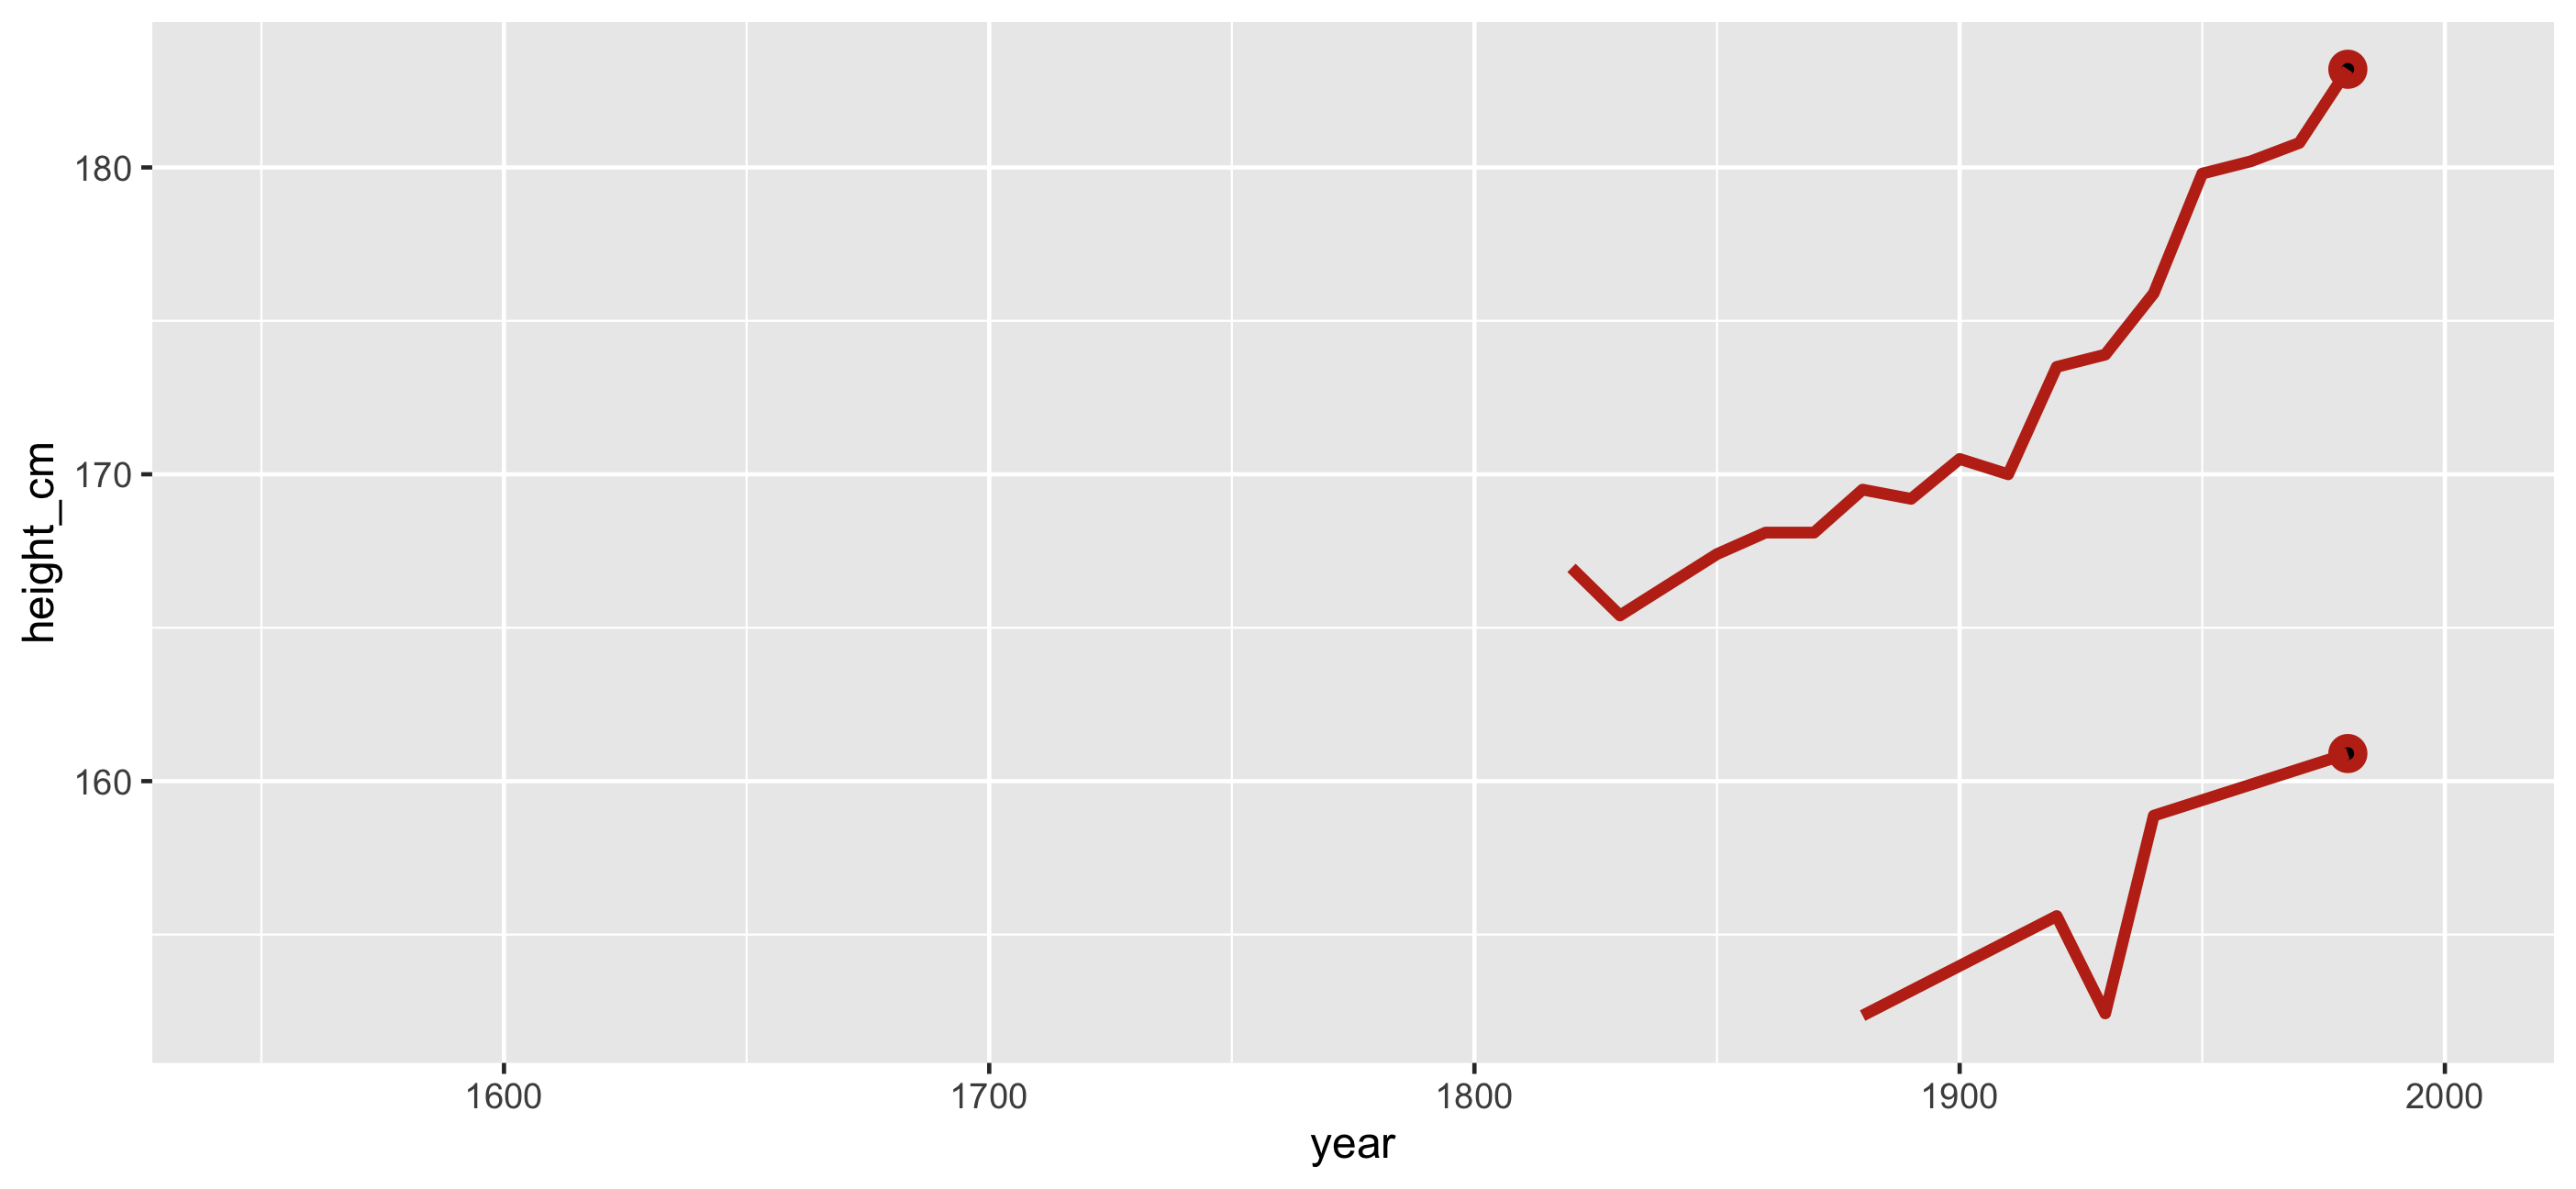
Join this feature back to the data
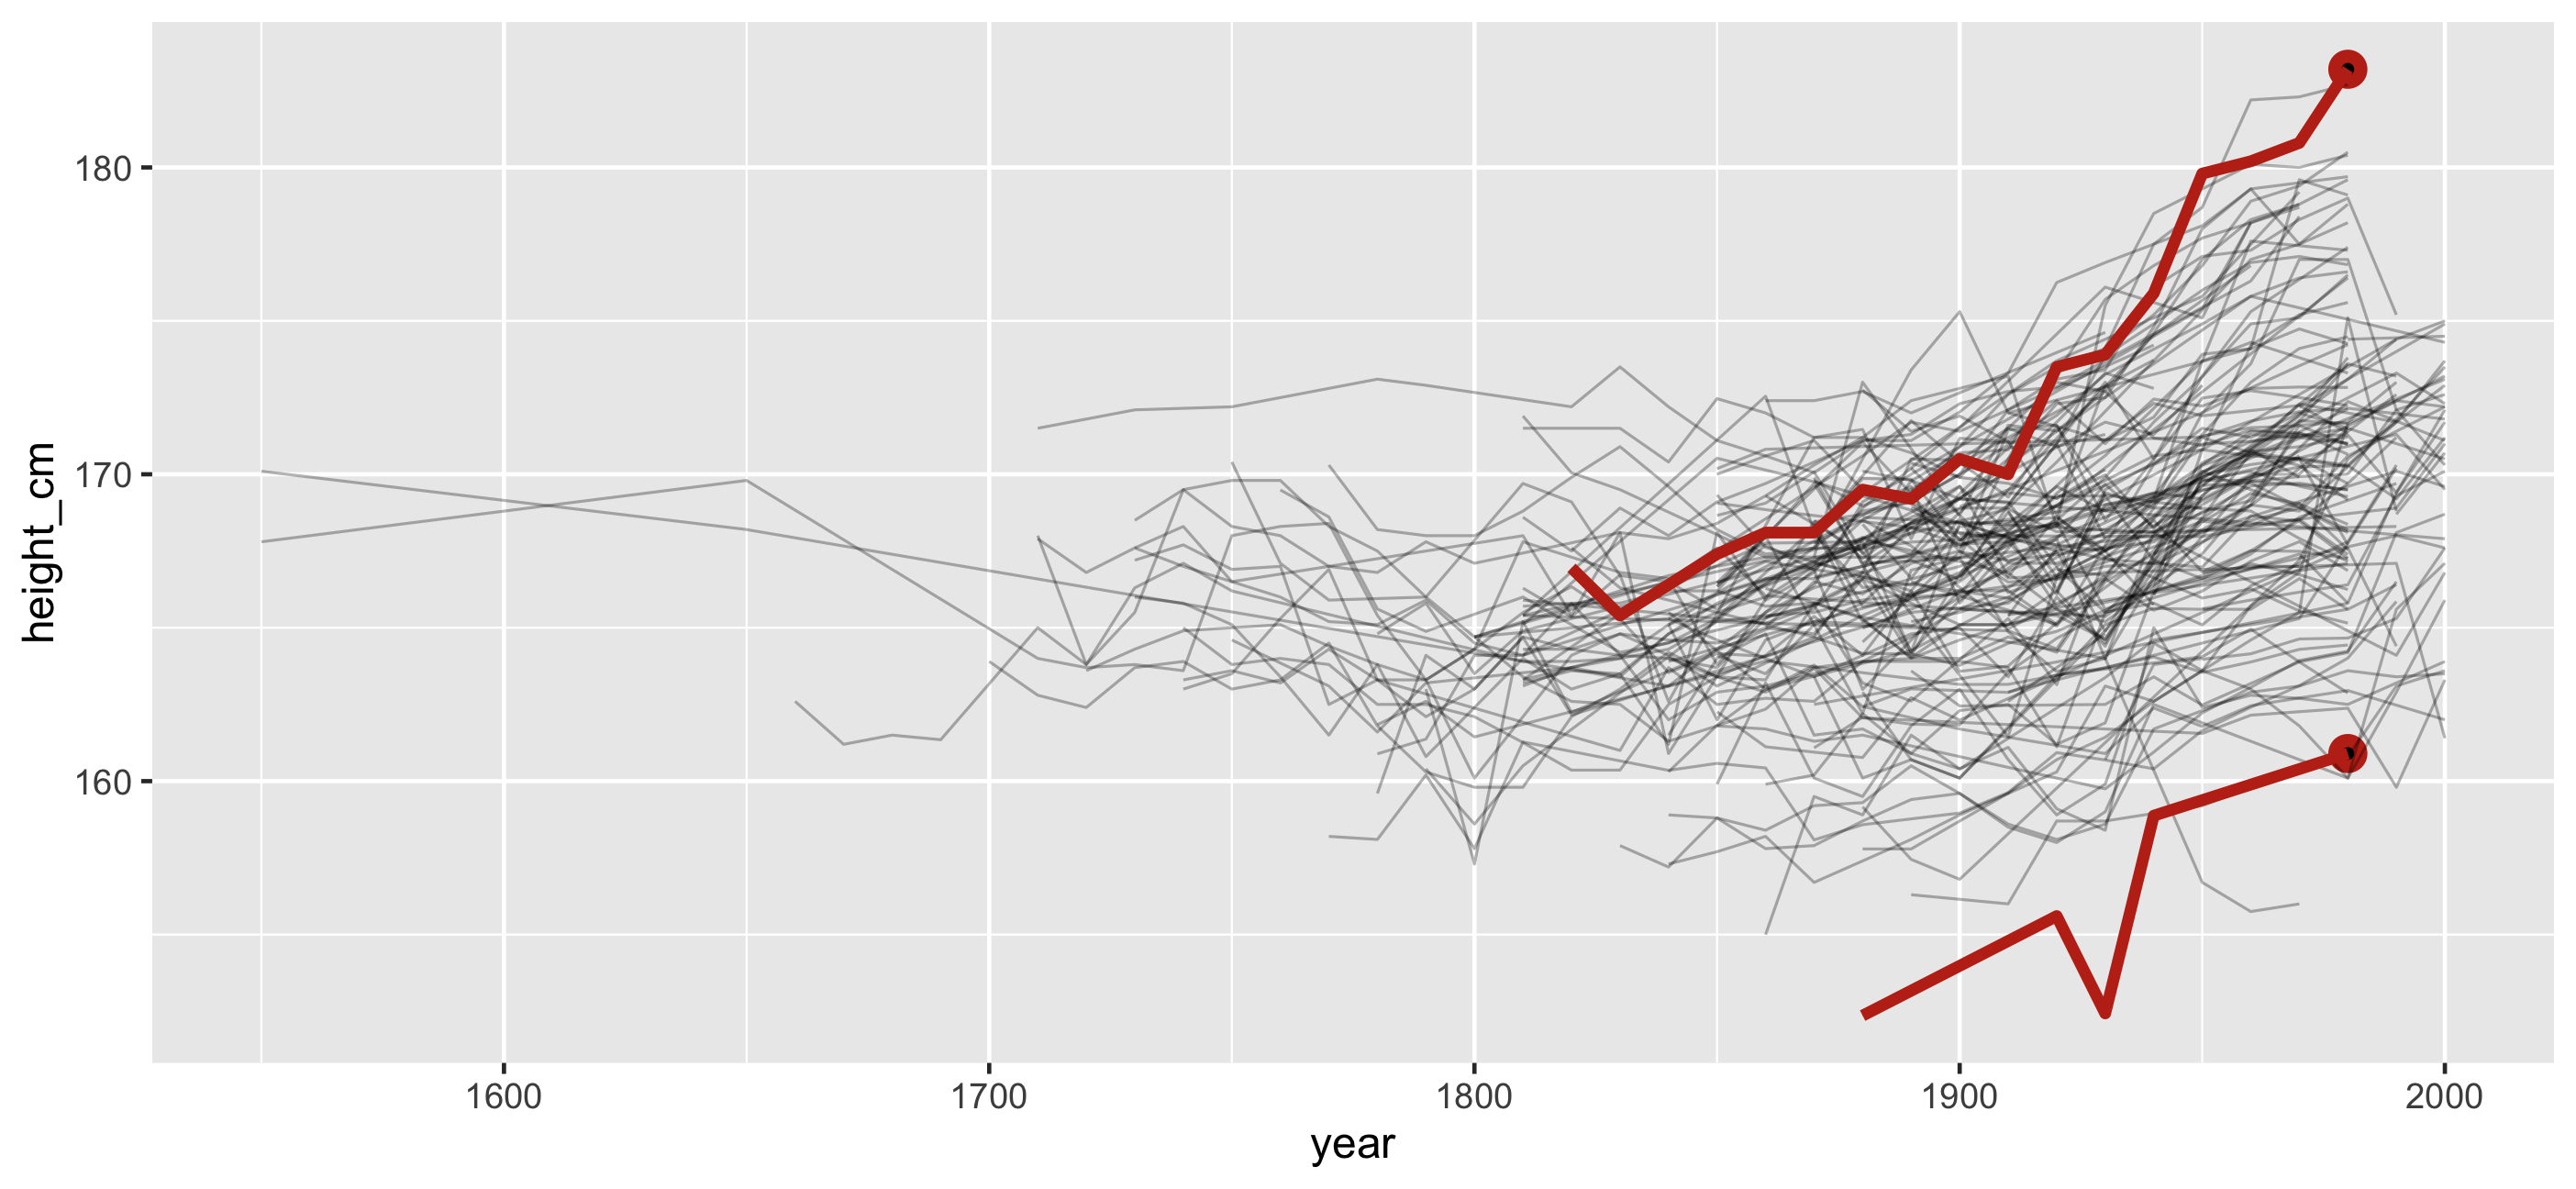
🎉 Countries with smallest and largest max height
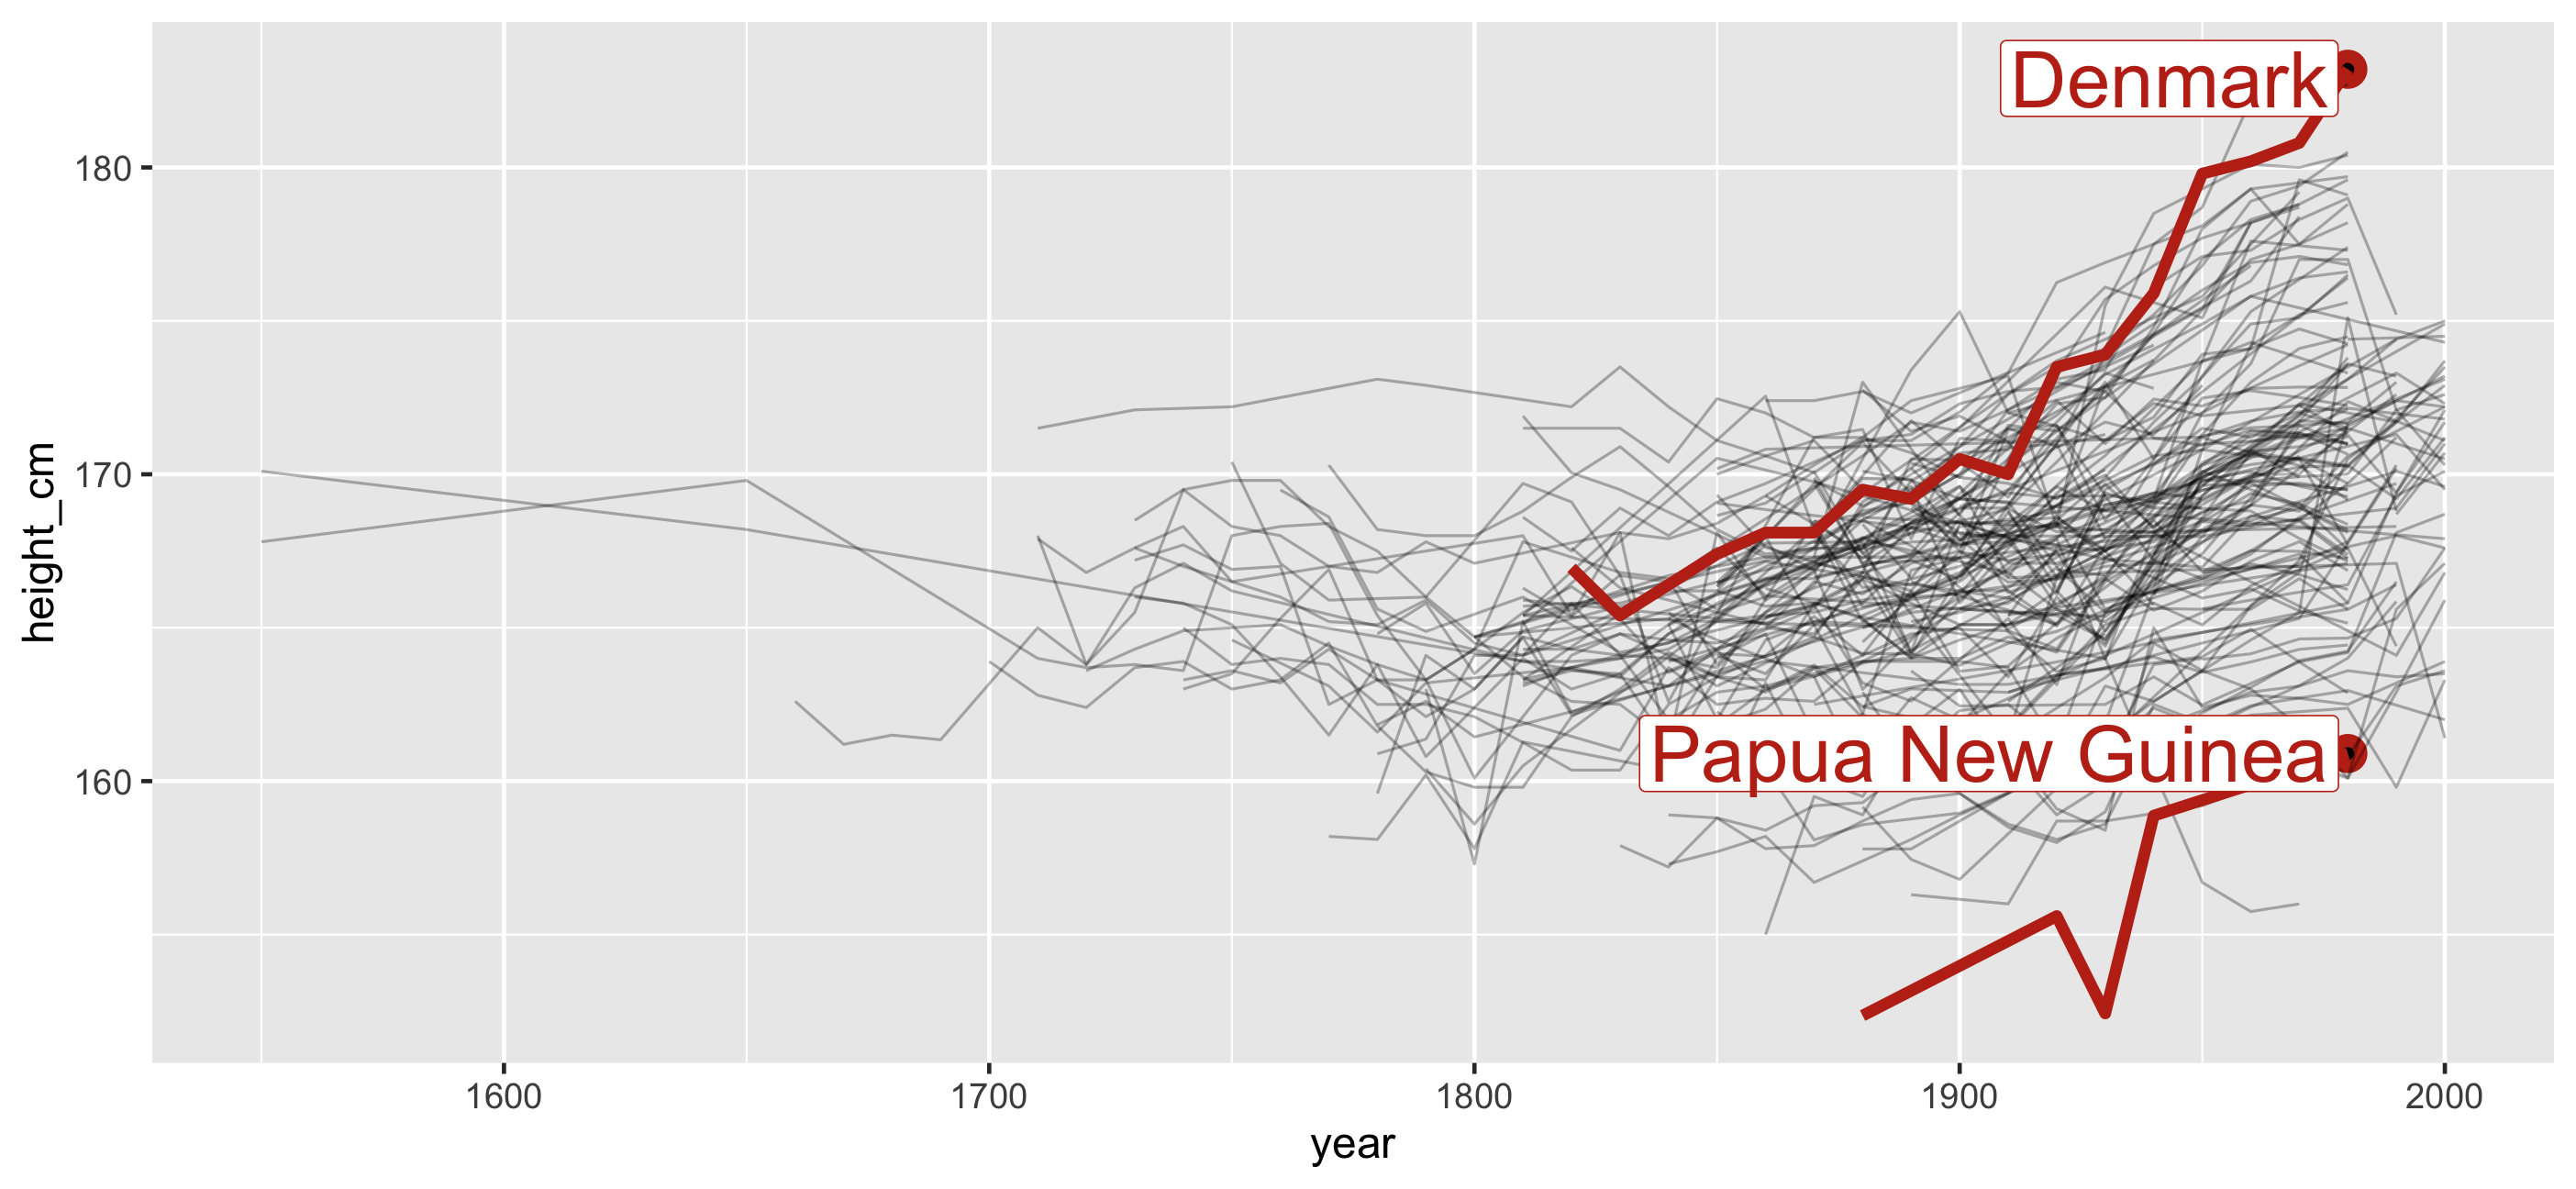
Let's see that one more time, but with the data
Identify features: one observation per key
## # A tsibble: 1,490 x 3 [!]## # Key: country [144]## country year height_cm## <chr> <dbl> <dbl>## 1 Afghanistan 1870 168.## 2 Afghanistan 1880 166.## 3 Afghanistan 1930 167.## 4 Afghanistan 1990 167.## 5 Afghanistan 2000 161.## 6 Albania 1880 170.## # … with 1,484 more rowsIdentify features: one observation per key
## # A tibble: 144 x 2## country max## <chr> <dbl>## 1 Afghanistan 168.## 2 Albania 170.## 3 Algeria 171.## 4 Angola 169.## 5 Argentina 174.## 6 Armenia 172.## # … with 138 more rowsIdentify important features and decide how to filter
heights_five %>% filter(max == max(max) | max == min(max))## # A tibble: 2 x 2## country max## <chr> <dbl>## 1 Denmark 183.## 2 Papua New Guinea 161.Join summaries back to data
heights_five %>% filter(max == max(max) | max == min(max)) %>% left_join(heights, by = "country")## # A tibble: 21 x 4## country max year height_cm## <chr> <dbl> <dbl> <dbl>## 1 Denmark 183. 1820 167.## 2 Denmark 183. 1830 165.## 3 Denmark 183. 1850 167.## 4 Denmark 183. 1860 168.## 5 Denmark 183. 1870 168.## 6 Denmark 183. 1880 170.## # … with 15 more rowsBut Nick, how did you create those summaries?
Identify features: one per key 
heights %>% features(height_cm, feat_five_num)## # A tibble: 144 x 6## country min q25 med q75 max## <chr> <dbl> <dbl> <dbl> <dbl> <dbl>## 1 Afghanistan 161. 164. 167. 168. 168.## 2 Albania 168. 168. 170. 170. 170.## 3 Algeria 166. 168. 169 170. 171.## 4 Angola 159. 160. 167. 168. 169.## 5 Argentina 167. 168. 168. 170. 174.## 6 Armenia 164. 166. 169. 172. 172.## # … with 138 more rowsWhat is the range of the data? feat_ranges
heights %>% features(height_cm, feat_ranges)## # A tibble: 144 x 5## country min max range_diff iqr## <chr> <dbl> <dbl> <dbl> <dbl>## 1 Afghanistan 161. 168. 7 3.27## 2 Albania 168. 170. 2.20 1.53## 3 Algeria 166. 171. 5.06 2.15## 4 Angola 159. 169. 10.5 7.87## 5 Argentina 167. 174. 7 2.21## 6 Armenia 164. 172. 8.82 5.30## # … with 138 more rowsDoes it only increase or decrease? feat_monotonic
heights %>% features(height_cm, feat_monotonic)## # A tibble: 144 x 5## country increase decrease unvary monotonic## <chr> <lgl> <lgl> <lgl> <lgl> ## 1 Afghanistan FALSE FALSE FALSE FALSE ## 2 Albania FALSE TRUE FALSE TRUE ## 3 Algeria FALSE FALSE FALSE FALSE ## 4 Angola FALSE FALSE FALSE FALSE ## 5 Argentina FALSE FALSE FALSE FALSE ## 6 Armenia FALSE FALSE FALSE FALSE ## # … with 138 more rowsWhat is the spread of my data? feat_spread
heights %>% features(height_cm, feat_spread)## # A tibble: 144 x 5## country var sd mad iqr## <chr> <dbl> <dbl> <dbl> <dbl>## 1 Afghanistan 7.20 2.68 1.65 3.27## 2 Albania 0.950 0.975 0.667 1.53## 3 Algeria 3.30 1.82 0.741 2.15## 4 Angola 16.9 4.12 3.11 7.87## 5 Argentina 2.89 1.70 1.36 2.21## 6 Armenia 10.6 3.26 3.60 5.30## # … with 138 more rowsfeatures: MANY more features in feasts 
feat_acf: autocorrelation-based features
feat_stl: STL (Seasonal, Trend, and Remainder by LOESS) decomposition
Problem #1: How do I look at some of the data?
Problem #1: How do I look at some of the data?
Problem #2: How do I find interesting observations?
Problem #1: How do I look at some of the data?
Problem #2: How do I find interesting observations?
Problem #1: How do I look at some of the data?
Problem #2: How do I find interesting observations?
Problem #3: How do I understand a model?
🤔
Problem #3: How do I understand a model?
Let's fit a mixed effects model.
Fixed effect of year + Random intercept for country
heights_fit <- lmer(height_cm ~ year + (1|country), heights)heights_aug <- heights %>% add_predictions(heights_fit, var = "pred") %>% add_residuals(heights_fit, var = "res")Problem #3: How do I understand a model?
## # A tsibble: 1,490 x 5 [!]## # Key: country [144]## country year height_cm pred res## <chr> <dbl> <dbl> <dbl> <dbl>## 1 Afghanistan 1870 168. 164. 4.59 ## 2 Afghanistan 1880 166. 164. 1.52 ## 3 Afghanistan 1930 167. 166. 0.823## 4 Afghanistan 1990 167. 168. -1.04 ## 5 Afghanistan 2000 161. 169. -7.10 ## 6 Albania 1880 170. 168. 2.39 ## # … with 1,484 more rowsProblem #3: How do I understand a model?
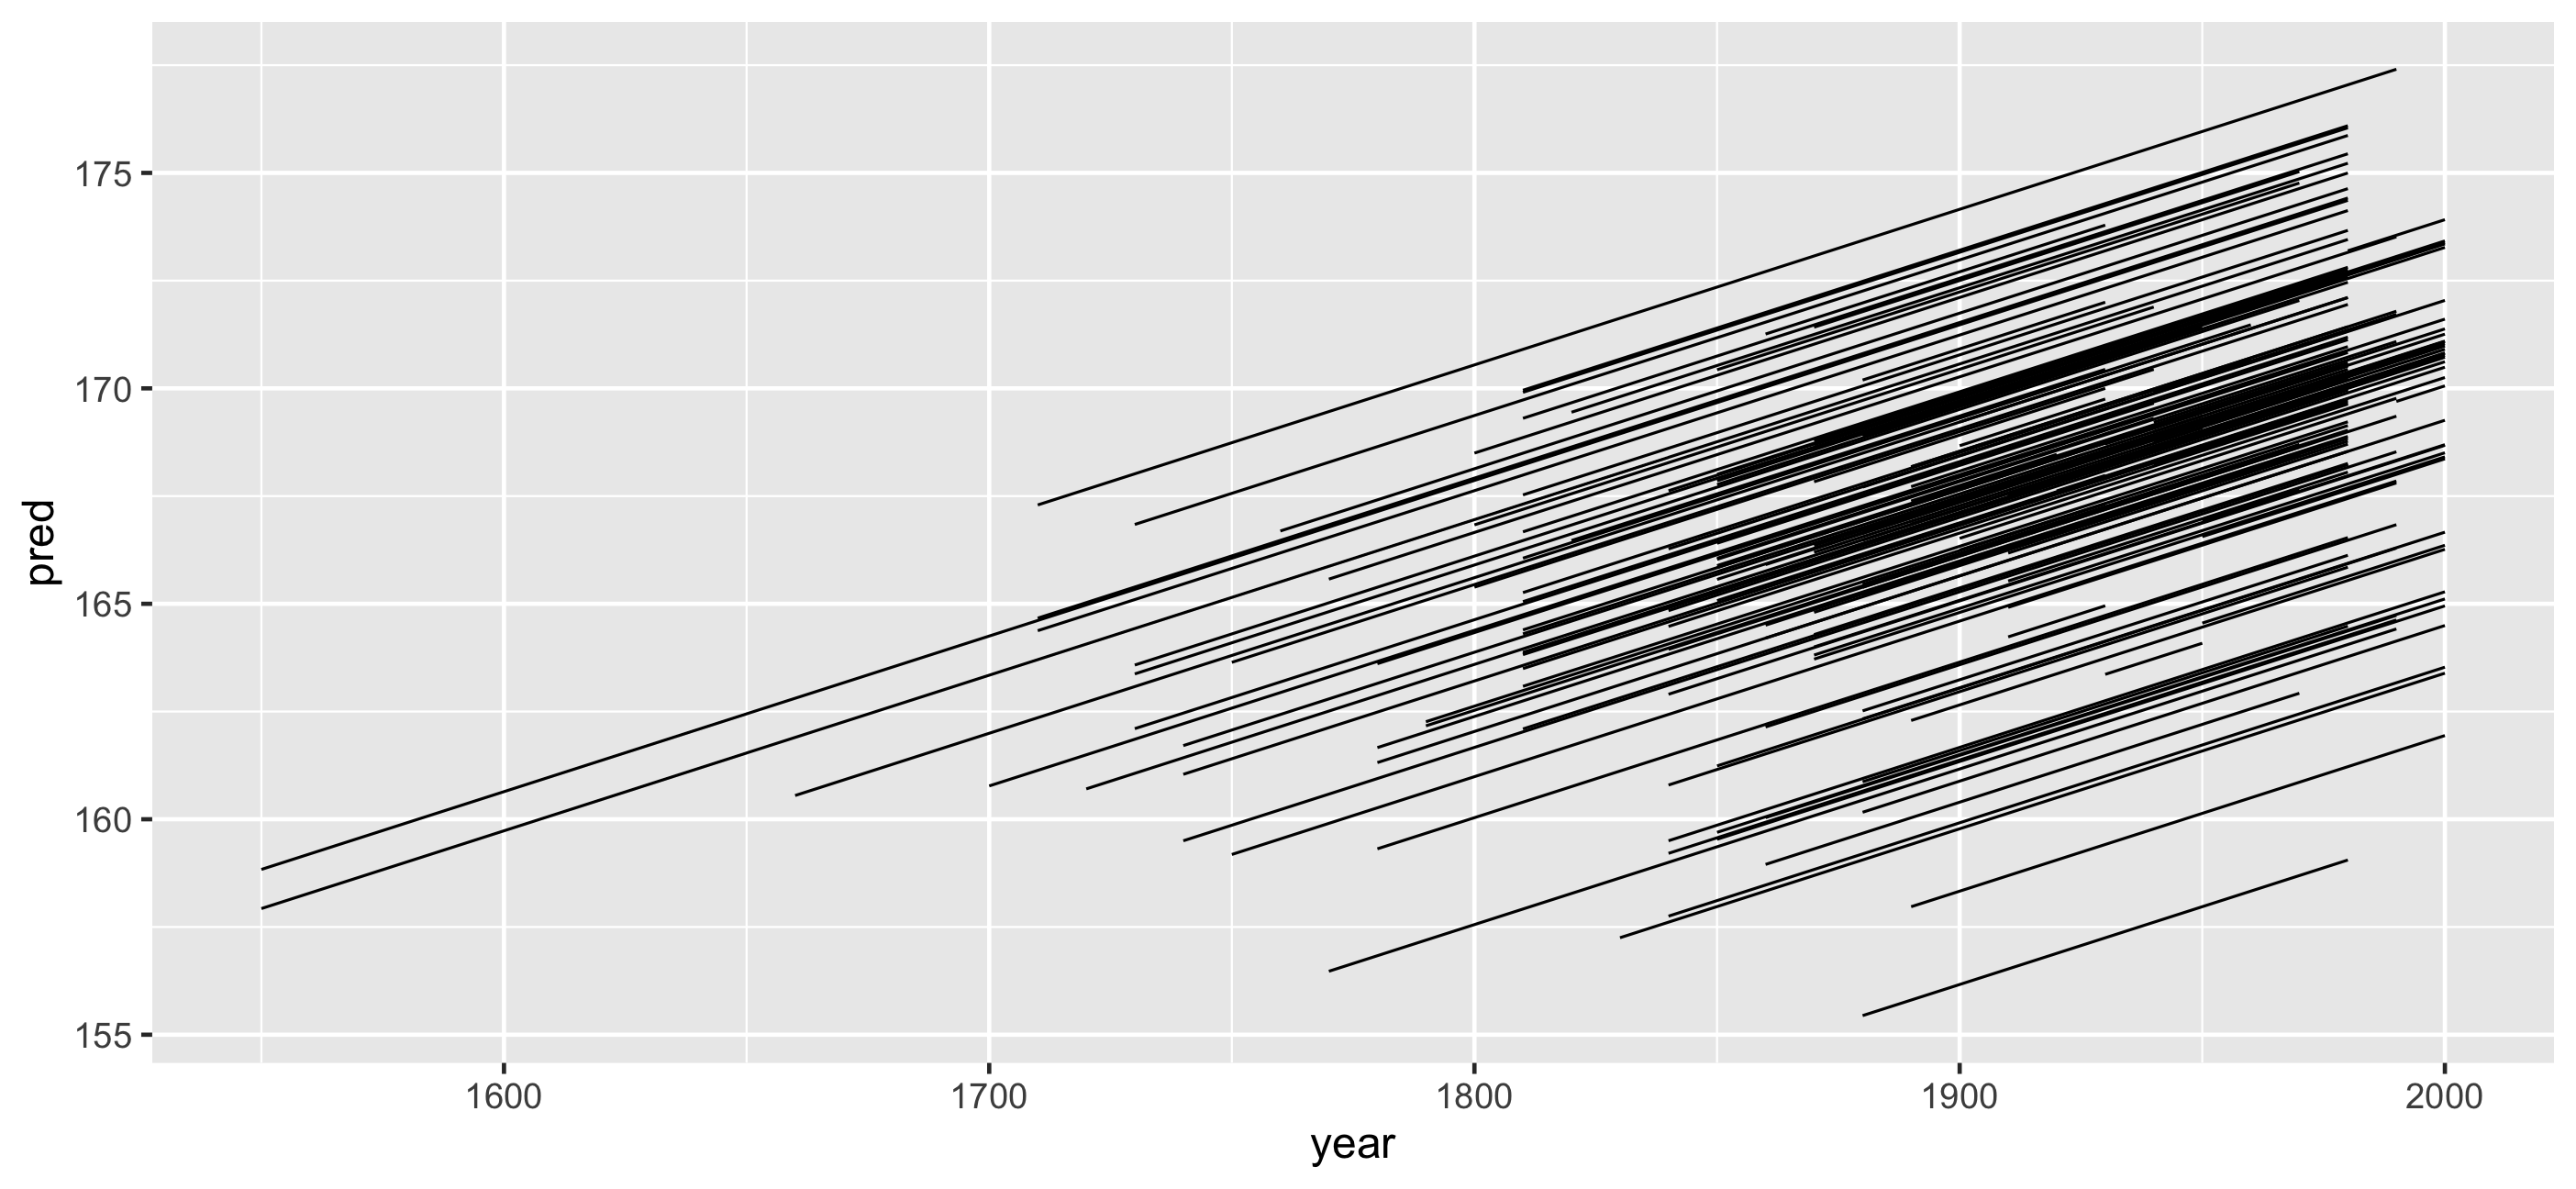
Look at many subsamples? facet_sample()
Look at many subsamples? facet_sample()
gg_heights_fit + facet_sample()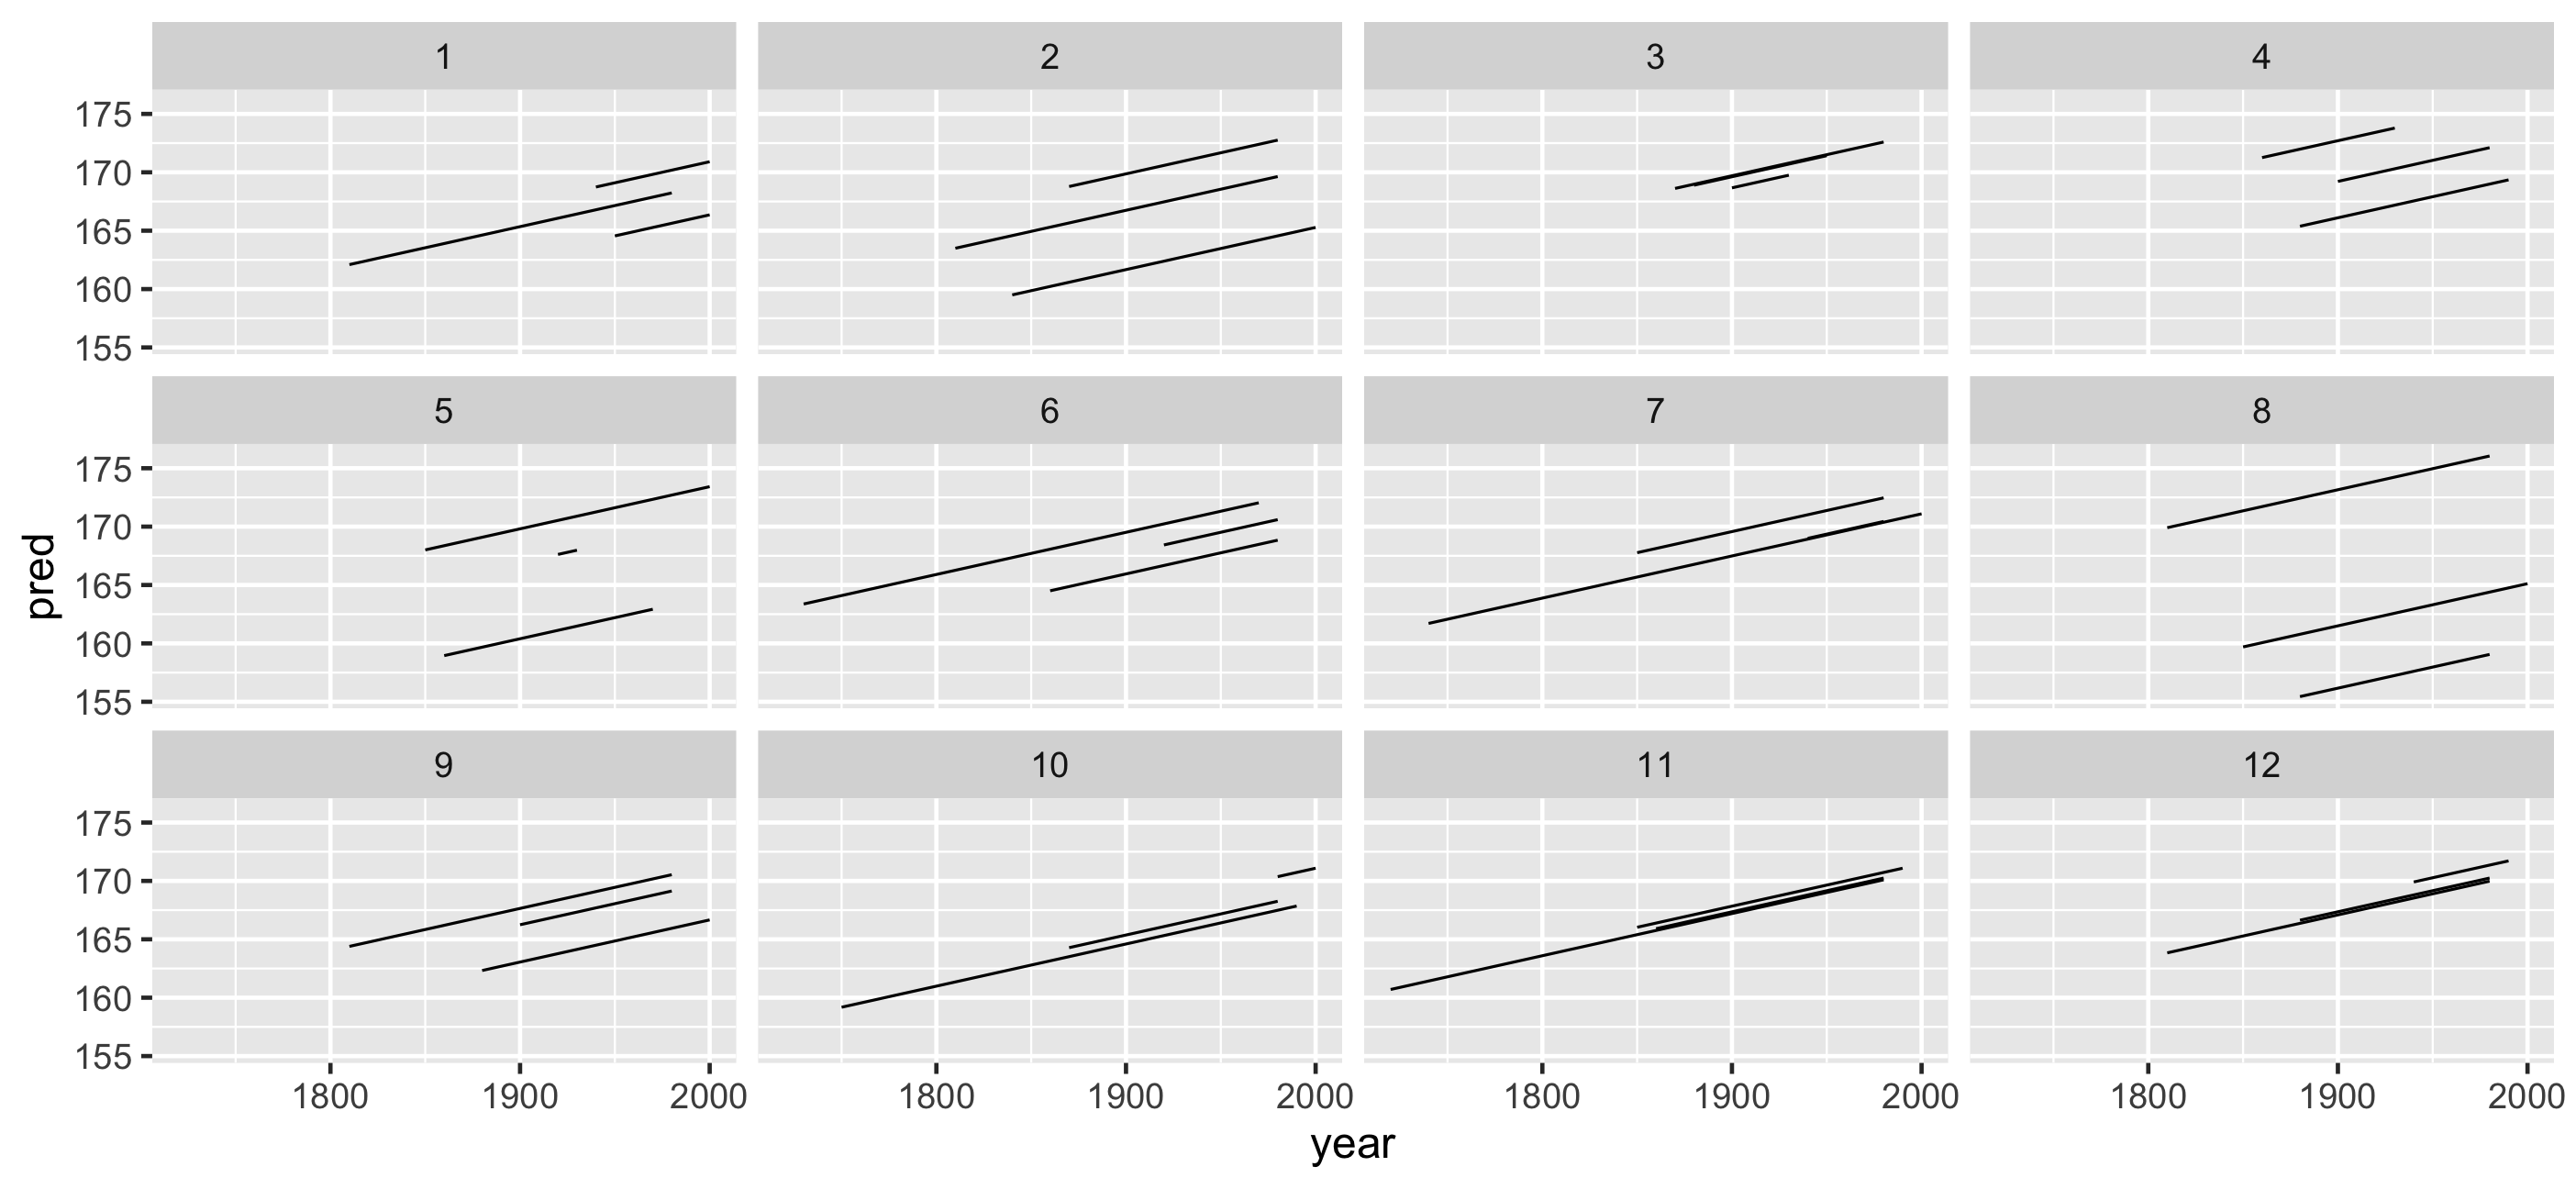
Look at all subsamples? facet_strata()
Look at all subsamples? facet_strata()
gg_heights_fit + facet_strata()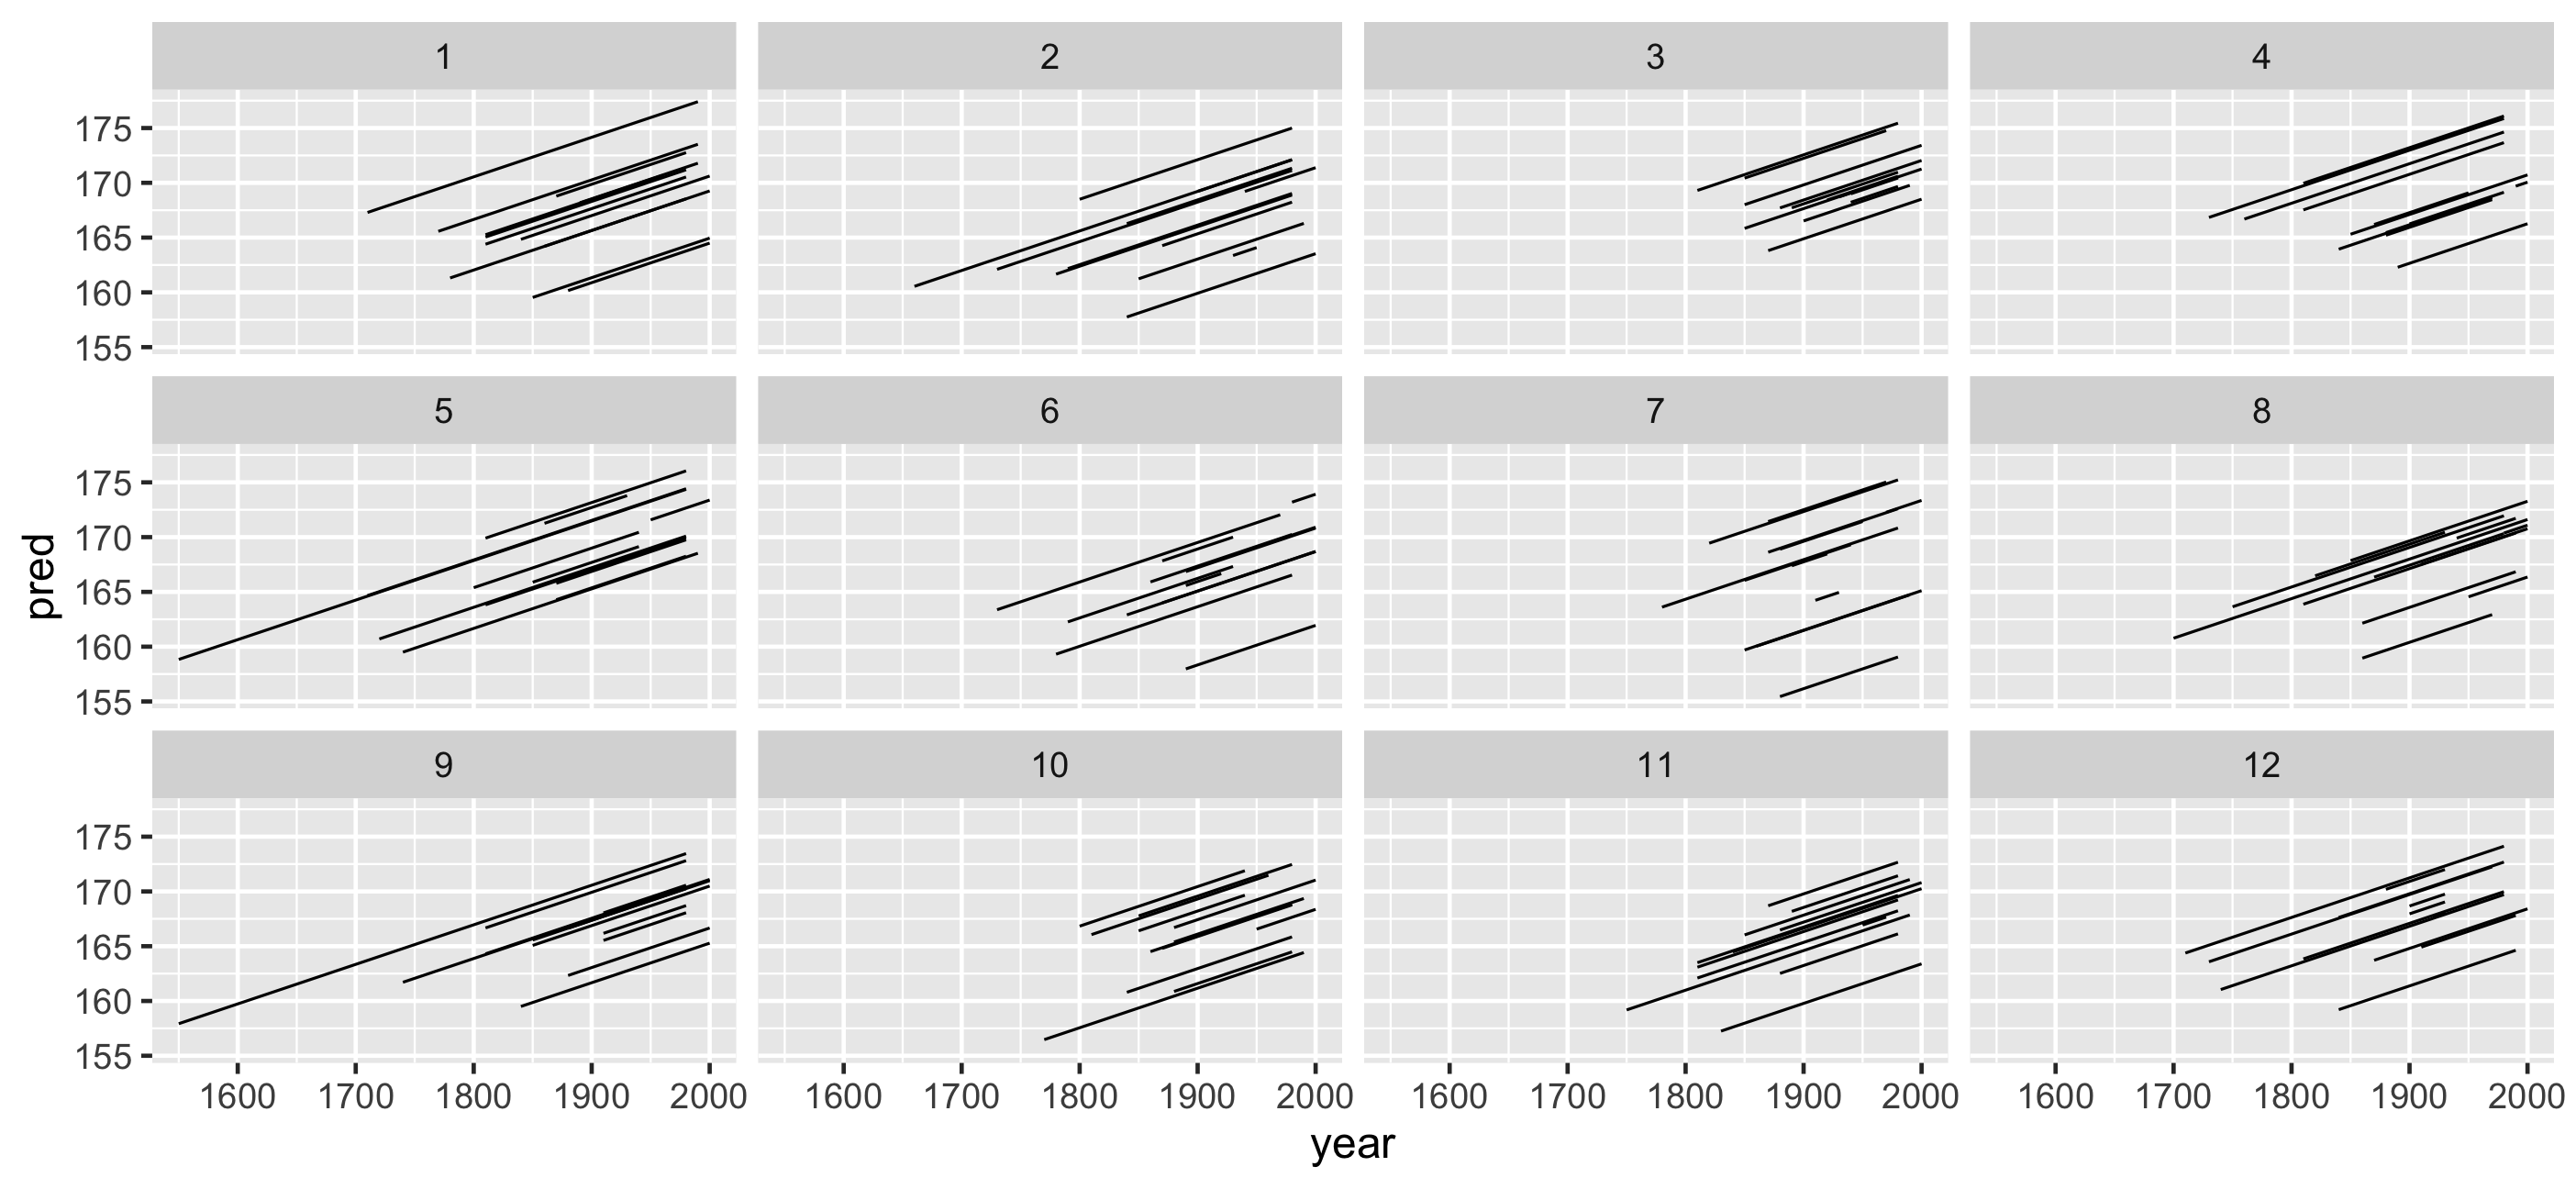
Look at all subsamples along residuals?
gg_heights_fit + facet_strata(along = -res)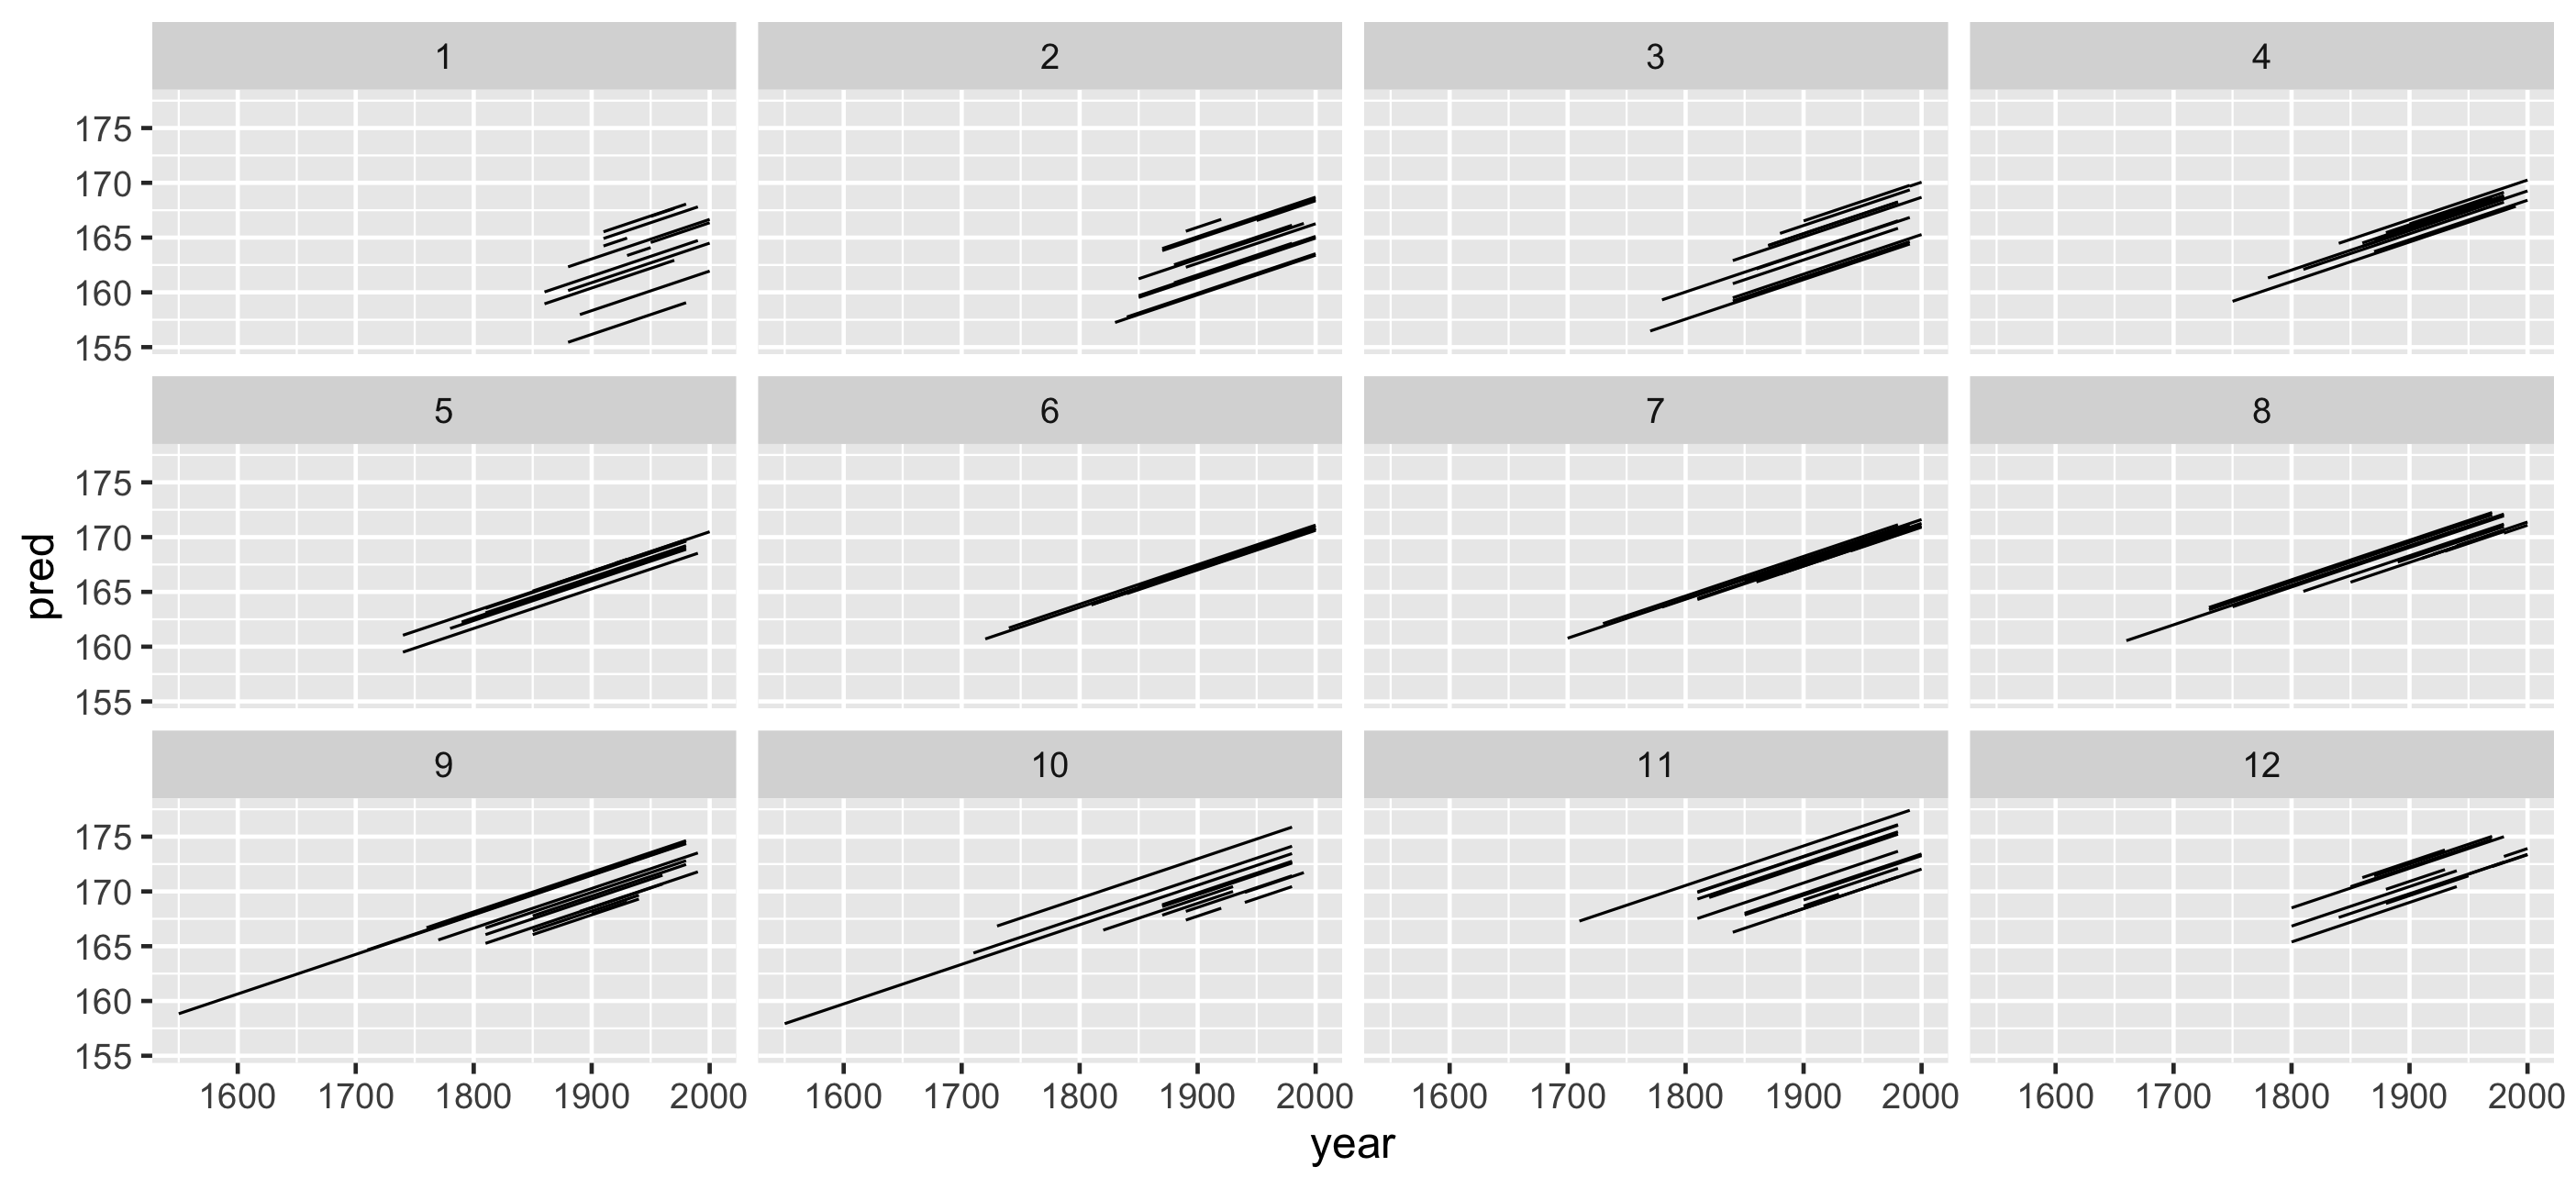
Look at the predictions with the data?
set.seed(2020-01-21)heights_sample <- heights_aug %>% sample_n_keys(size = 9) %>% ggplot(aes(x = year, y = pred, group = country)) + geom_line() + facet_wrap(~country)heights_sampleLook at the predictions with the data?
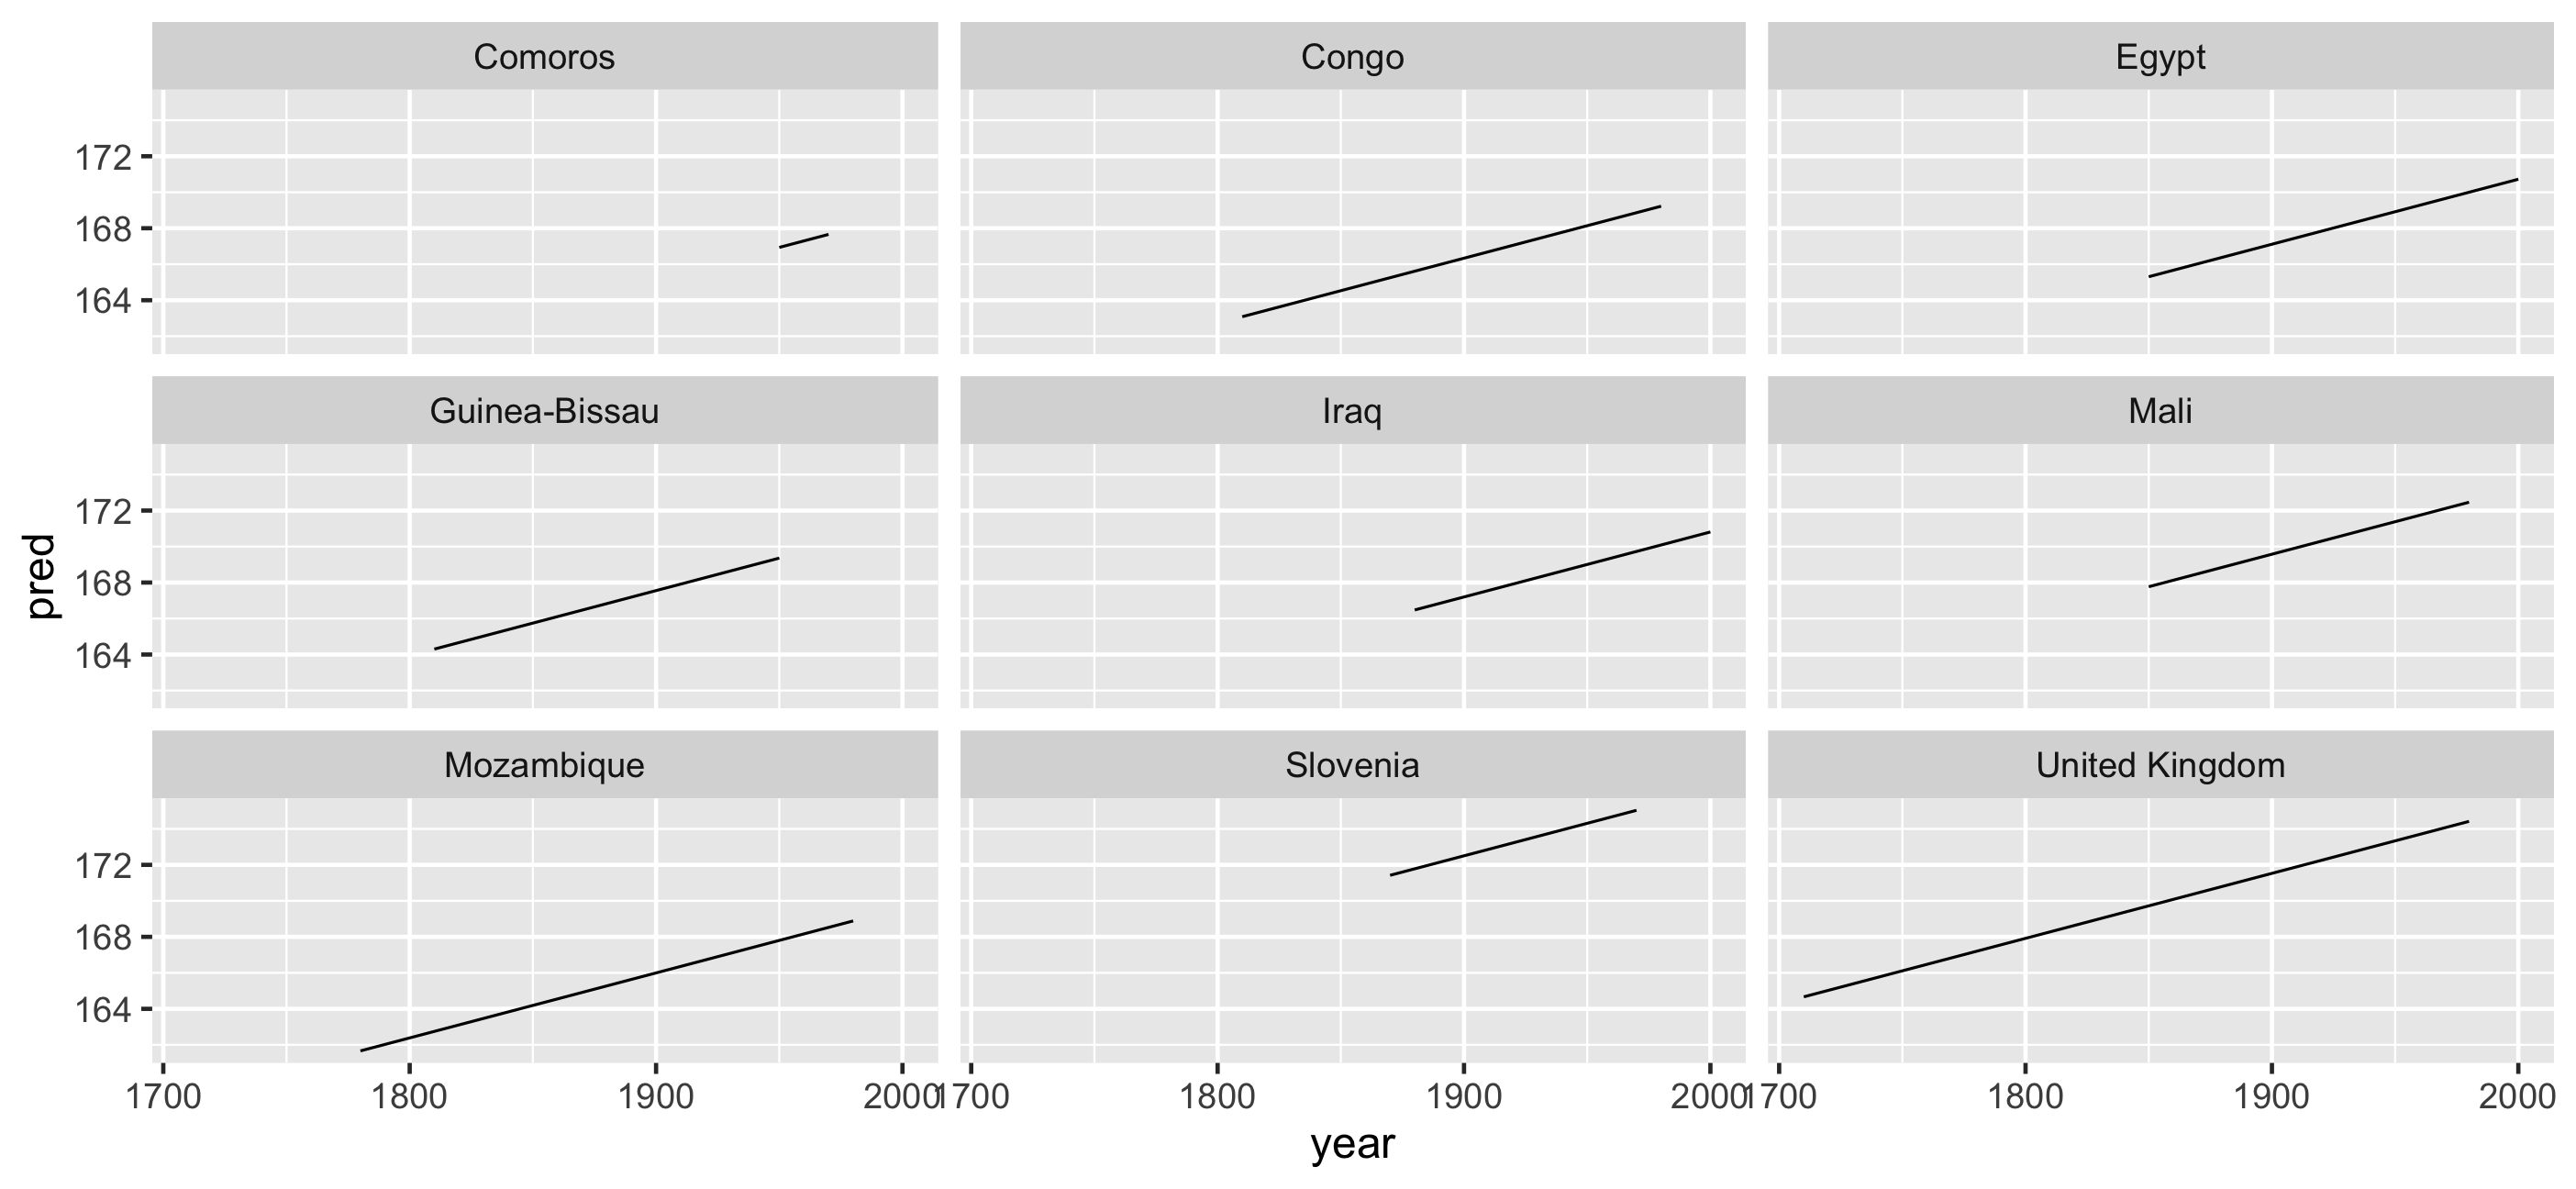
Look at the predictions with the data?
heights_sample + geom_point(aes(y = height_cm))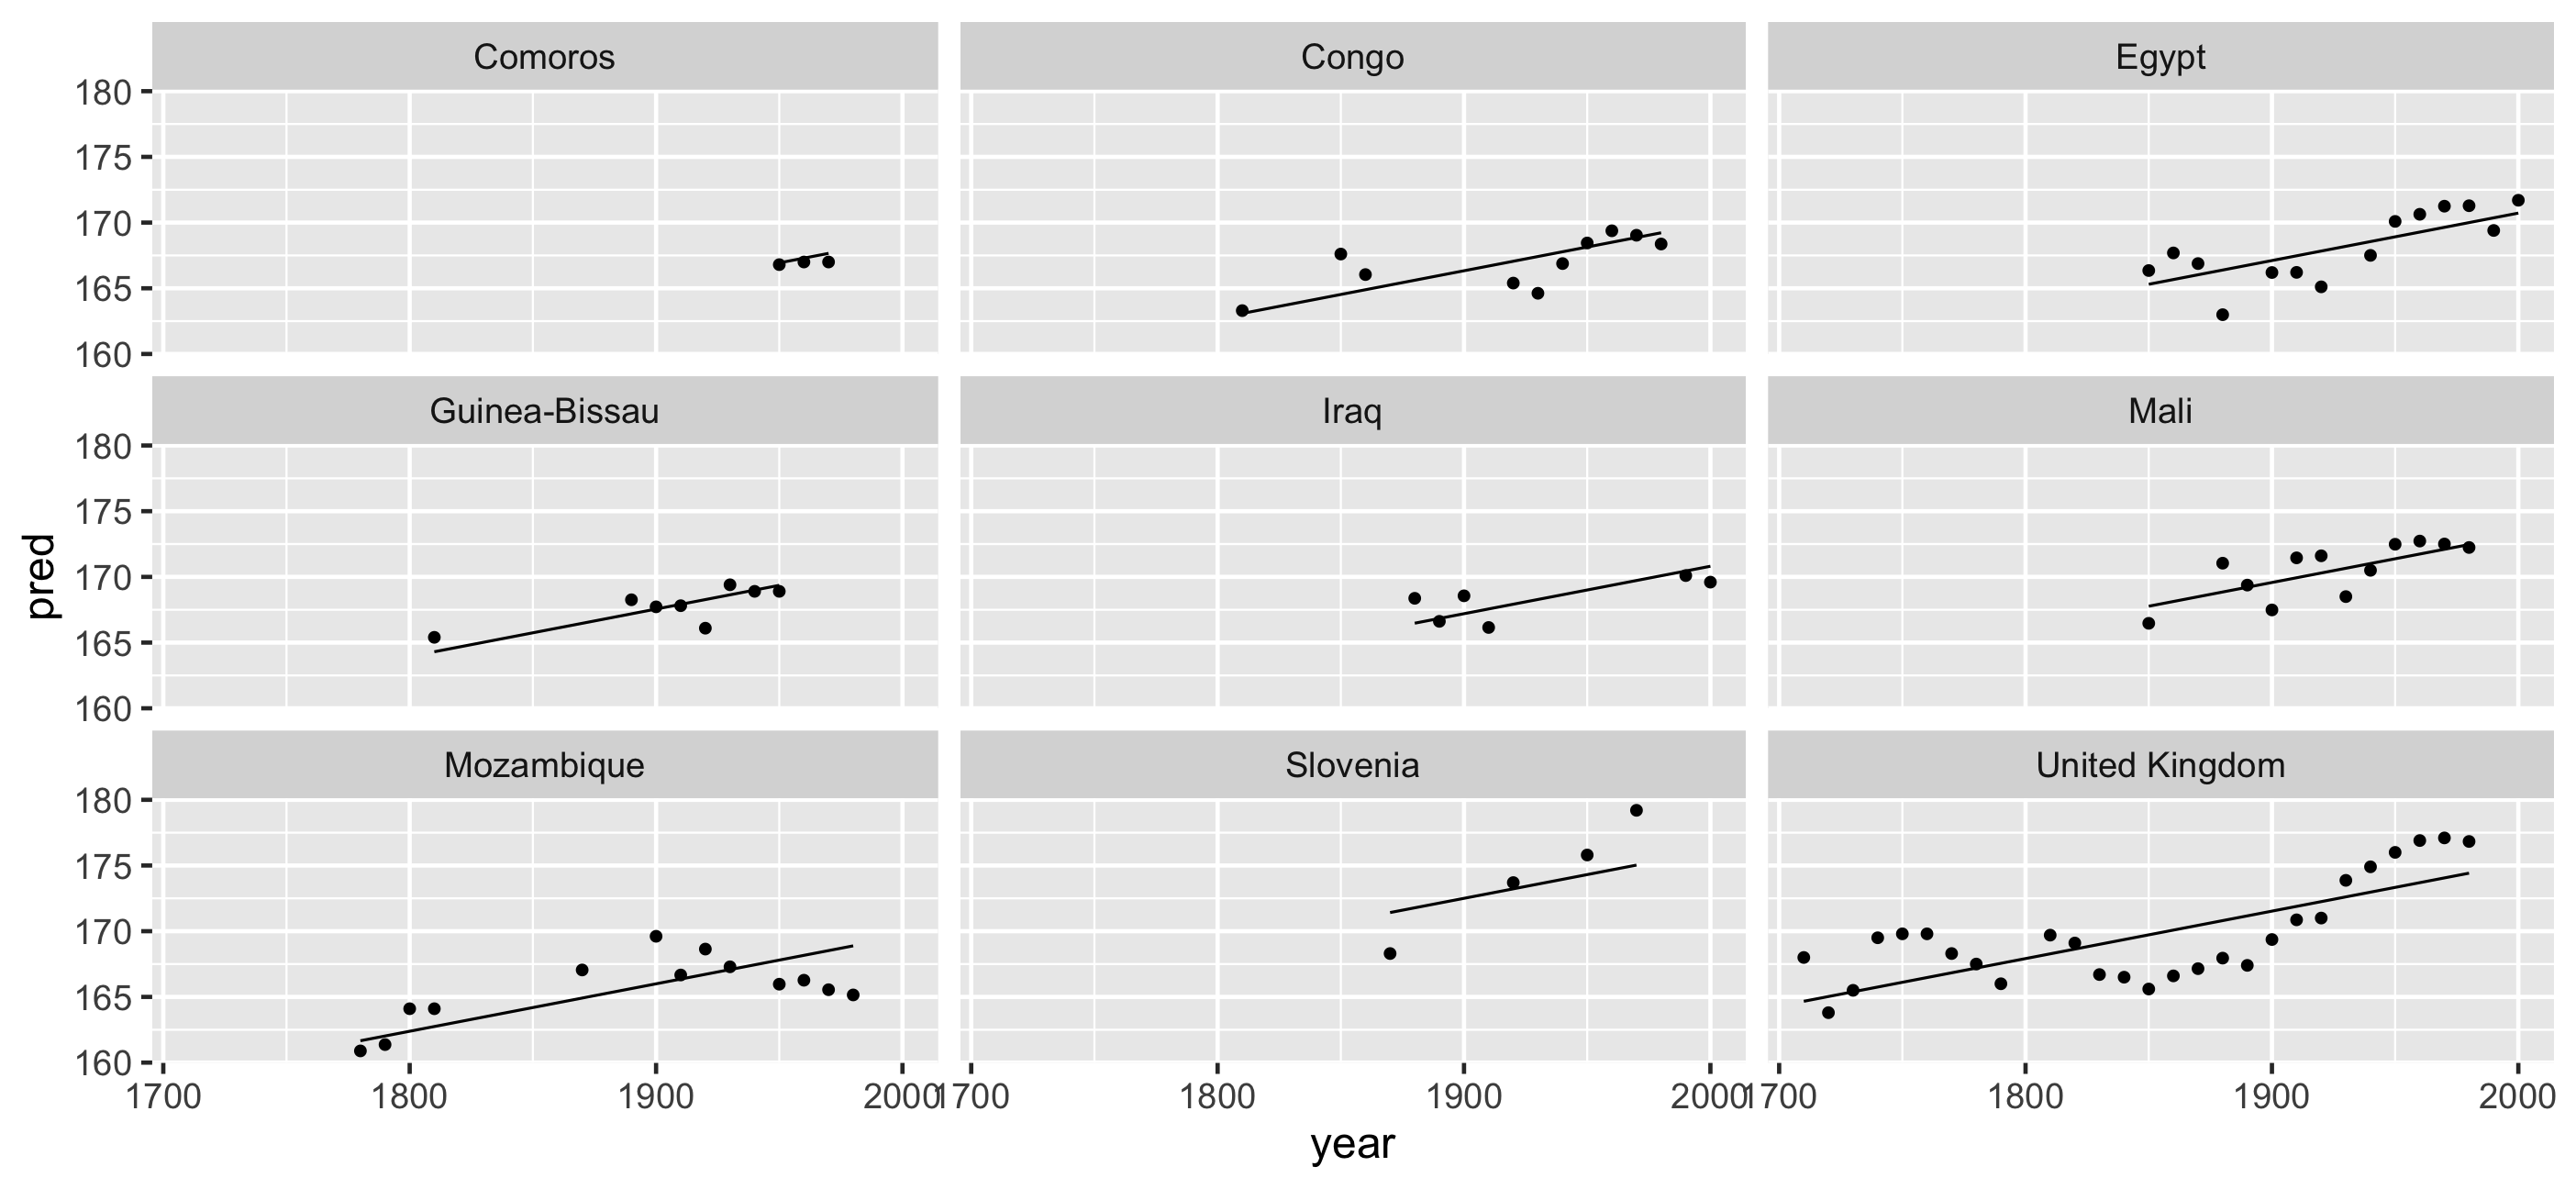
Take homes
Problem #1: How do I look at some of the data?
- Longitudinal data as a time series 💹
- Specify structure, get a free lunch. 🥪
- Look at as much of the raw data as possible 🍣
- Use
facet_sample()/facet_strata()
Take homes
Problem #2: How do I find interesting observations?
- Decide what features are interesting
- Summarise down to one observation per key
- Decide how to filter
- Join this feature back to the data
Take homes
Problem #3: How do I understand a model?
- Look at (one, more or all!) subsamples
- Arrange subsamples
- (actually use similar approaches to earlier!)
Future Directions
More features (summaries)
Generalise beyond longitudinal data
Explore stratification process
Work with dplyr::across() & dplyr::pick()
Thanks
- Di Cook
- Tania Prvan
- Stuart Lee
- Mitchell O'Hara Wild
- Earo Wang
- Rob Hyndman
- Nick Golding
- Miles McBain
- Hadley Wickham
- Garrick Aden-Buie
- Monash University
- ACEMS
- Telethon Kids Institute
Resources
Colophon
Slides made using xaringan
Extended with xaringanthemer
Colours modified from ochRe::lorikeet
Header font is Josefin Sans
Body text font is Montserrat
Code font is Fira Mono
Learning more
BONUS ROUND
What about interactive graphics?
if you make a tooltip or rollover, assume no one will ever see it" -- Archie Tse, NYT
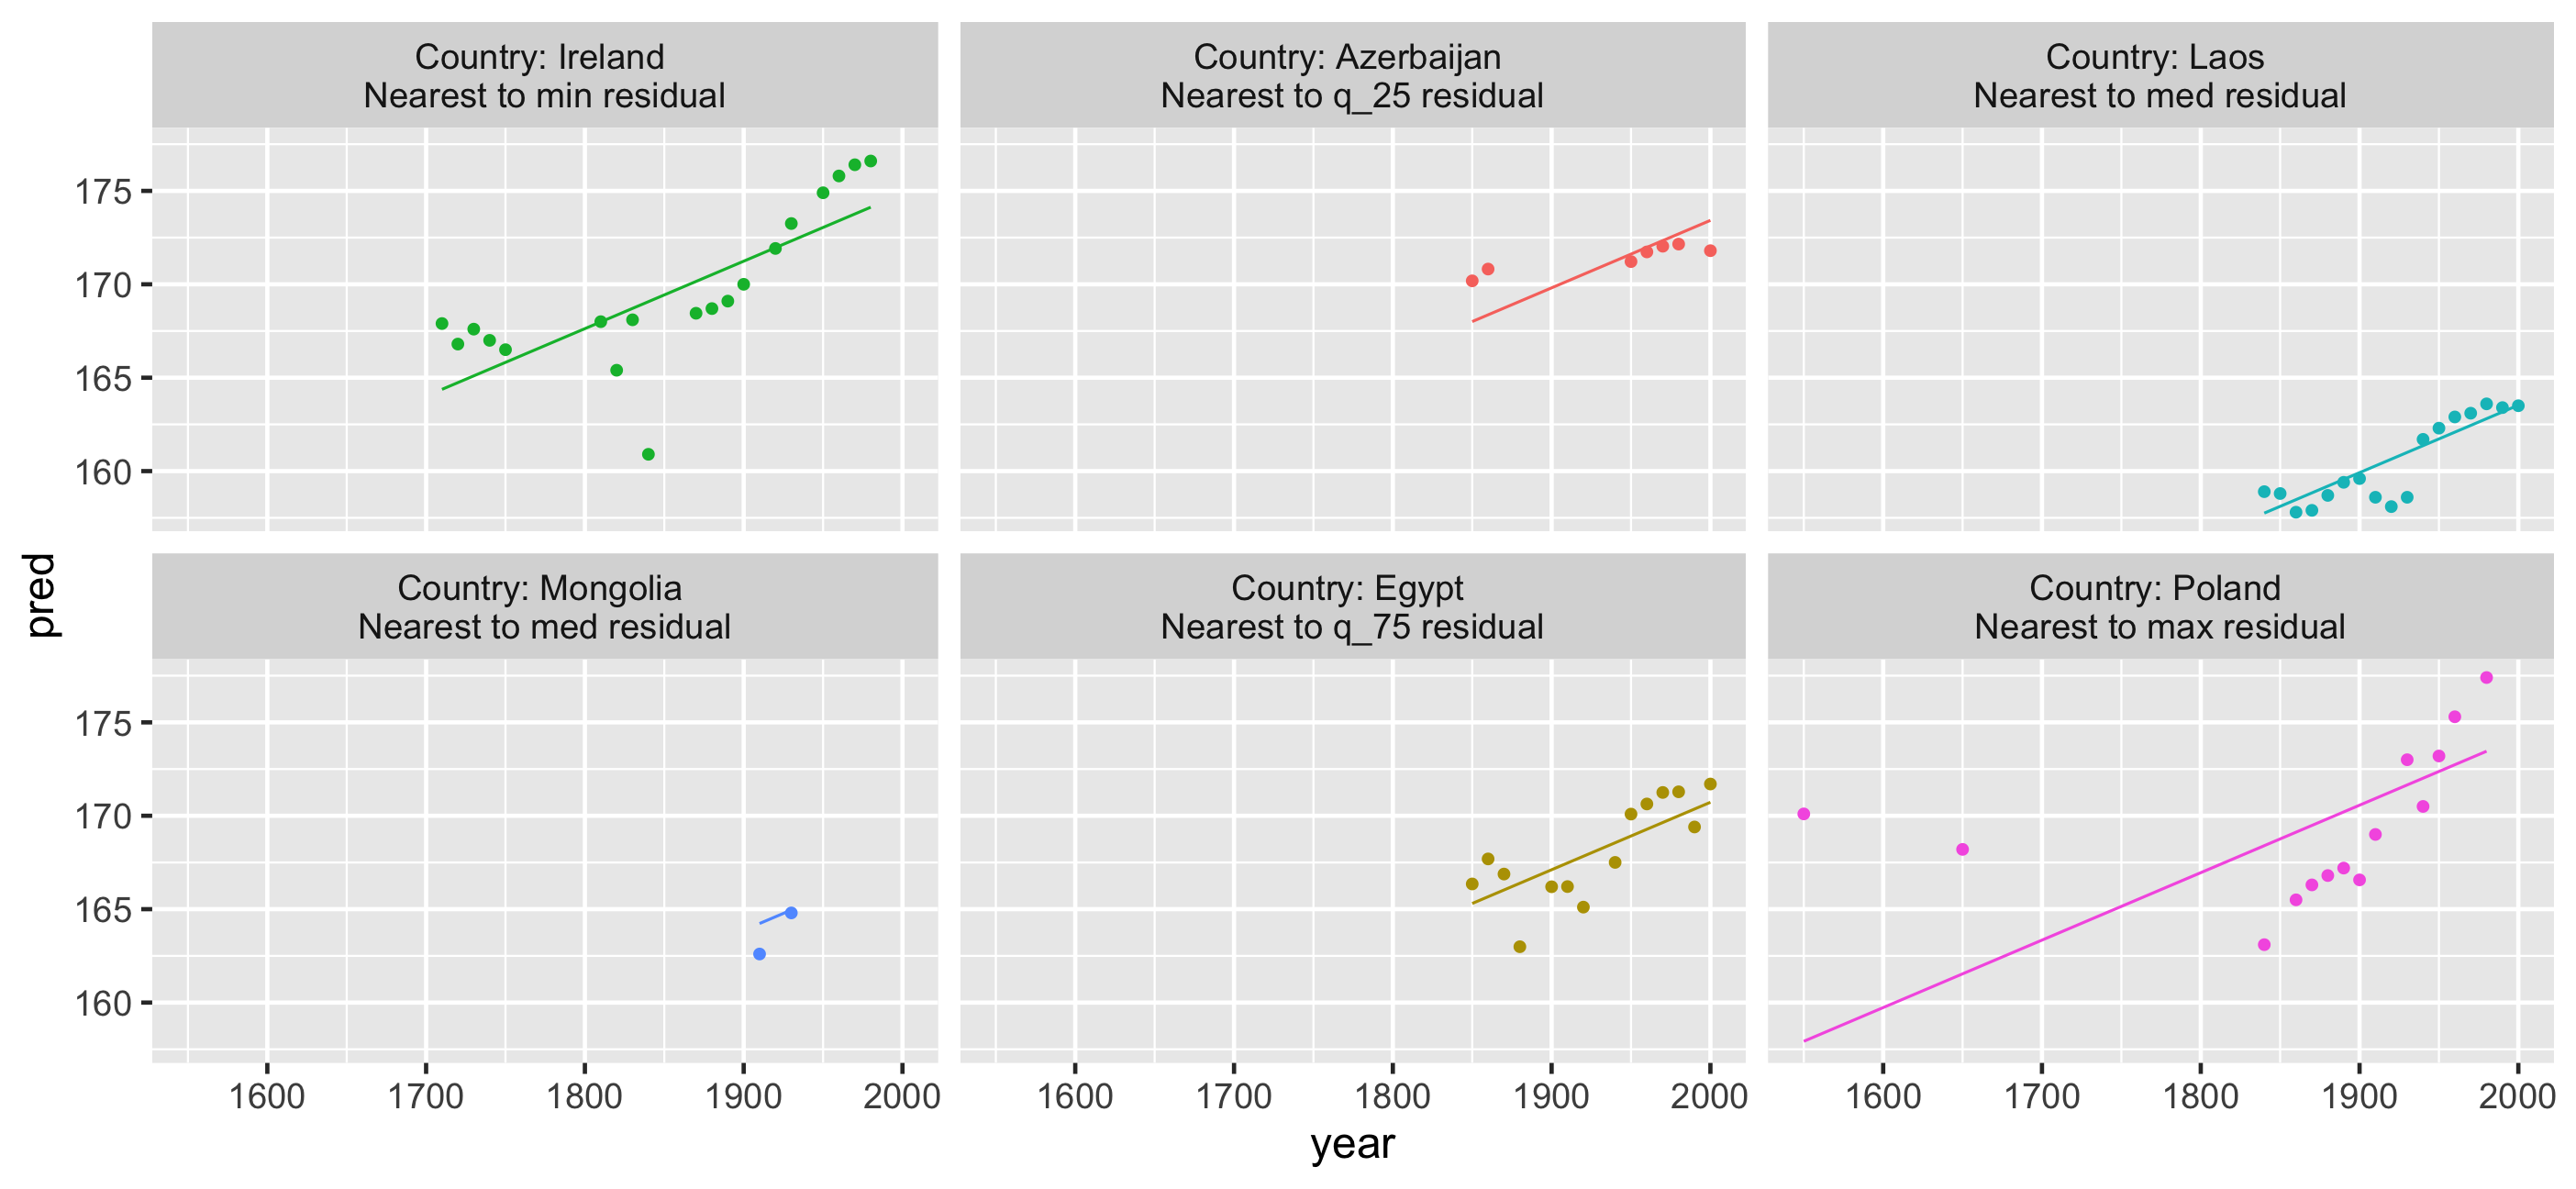
What if we grabbed a sample of those who have the best, middle, and worst residuals?
What if we grabbed a sample of those who have the best, middle, and worst residuals?
summary(heights_aug$res)## Min. 1st Qu. Median Mean 3rd Qu. Max. ## -8.1707 -1.6202 -0.1558 0.0000 1.3545 12.1729What if we grabbed a sample of those who have the best, middle, and worst residuals?
summary(heights_aug$res)## Min. 1st Qu. Median Mean 3rd Qu. Max. ## -8.1707 -1.6202 -0.1558 0.0000 1.3545 12.1729Which countries are nearest to these statistics?
use keys_near()
keys_near(heights_aug, var = res)## # A tibble: 6 x 5## country res stat stat_value stat_diff## <chr> <dbl> <fct> <dbl> <dbl>## 1 Ireland -8.17 min -8.17 0 ## 2 Azerbaijan -1.62 q_25 -1.62 0.000269## 3 Laos -0.157 med -0.156 0.00125 ## 4 Mongolia -0.155 med -0.156 0.00125 ## 5 Egypt 1.35 q_75 1.35 0.000302## 6 Poland 12.2 max 12.2 0🔑 🔑 🔑 that best match the 5 number summary.
Join data back and explore
End.
